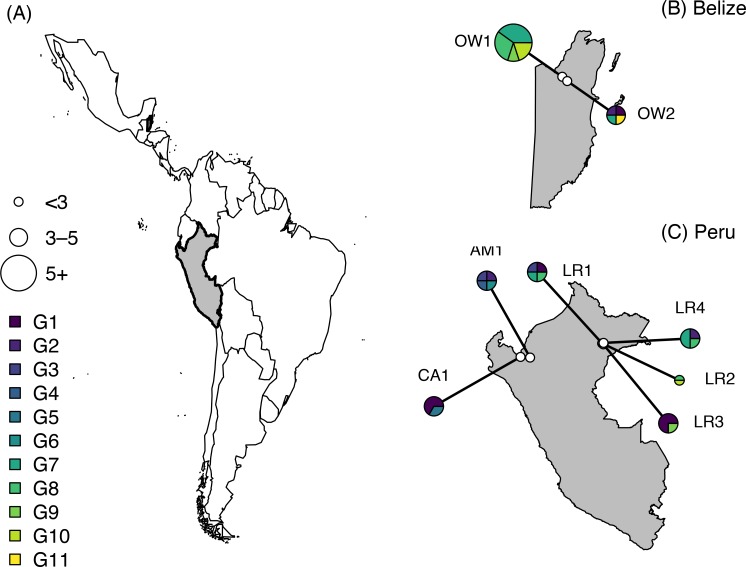
Fig 2. Distribution of the 11 paraphyletic genotypes identified from the 35 vampire bat Bartonella spp. gltA sequences.
Belize and Peru are shown in grey with black outlines (A). Insets show the location of sampling sites (white), and pie graphs illustrate the genotype composition of Bartonella spp. per site (B and C) pooled across both study years. Pie charts are scaled by sample size. Shapefiles were obtained from the maps and mapdata packages in R [86].

