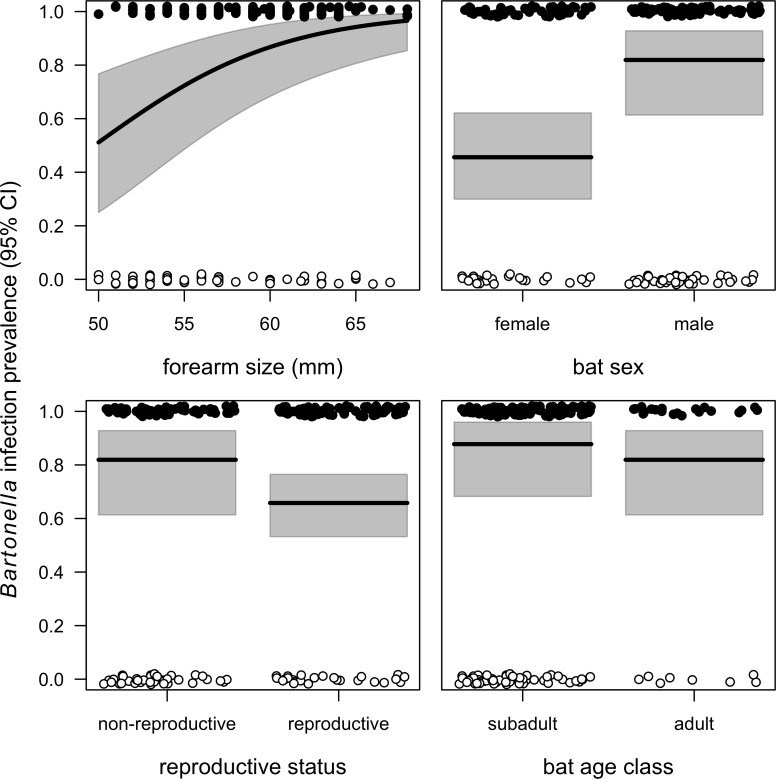
Fig 5. Modeled Bartonella infection prevalence (black line) and 95% confidence intervals (grey) from the GLMM of individual risk factors, displayed in order of effect size: forearm size (χ2 = 14.01), bat sex (χ2 = 8.48), reproductive status (χ2 = 2.79), and age (χ2 = 0.76).
Individual data points are jittered and colored by infection status (black = positive, white = negative).

