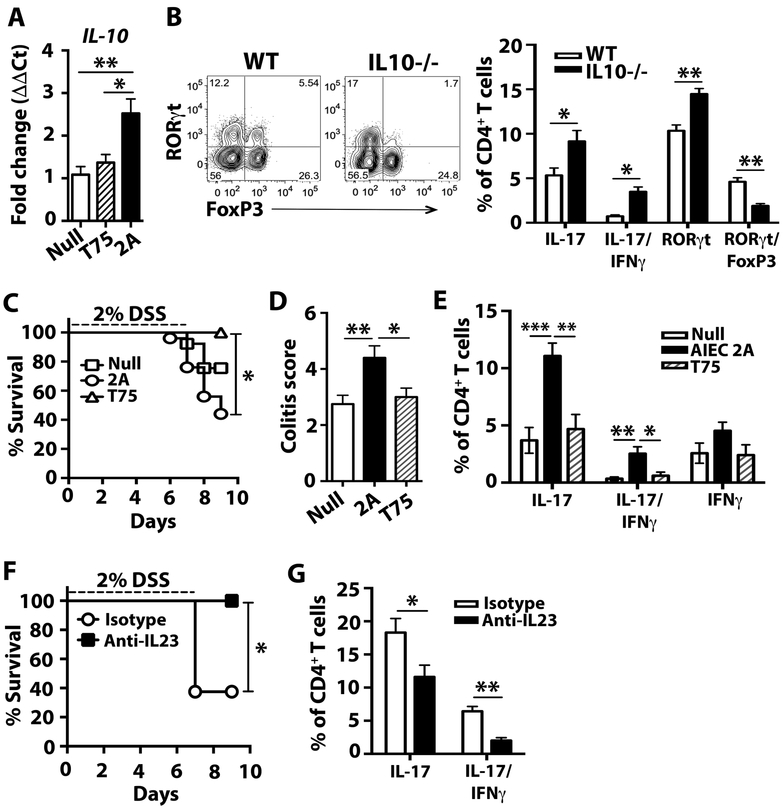
Fig. 5. CD-SpA E. coli 2A exacerbates DSS-induced colitis in IL10-deficient mice.
A. qPCR analysis of Il10 expression in lamina propria mononuclear cells from mono-colonized mice 5 days after colonization with CD-SpA E. coli 2A, T75, or no colonization control. Bar graphs represent geometric mean for 5–6 mice / group from 2 independent experiments. Error bars represent the SEM. P-values < 0.05 is indicated, T-test. B. Germ-free WT and IL-10−/− mice were colonized with 2 × 10⁹ CFU of AIEC isolate 2A. Two weeks after colonization, flow cytometry of live, CD4+ T cells was used to evaluate RORγt and Foxp3 expression as well as IL-17 and IFNγ expression in colonic lamina propria cells following 4 hour stimulation with PMA/ionomycin with Brefeldin-A. Mean percentages are shown for each experimental group and error bars reflect SEM. Data are a composite of 2 independent experiments with 4–6 animals / group. C-E. Germ-free IL-10−/− mice were colonized with 2 × 10⁹ CFU of CD-SpA-derived AIEC isolate 2A, non-AIEC T75 or media control. Ten days after colonization, mice were exposed to 2% DSS ad libitum for 7 days. C. Percent survival following DSS administration is shown. 2A N = 15, T75 N = 8, Media N = 13,. Log rank test, P<0.05. D. Colonic histopathology score on day 10 following DSS exposure. Mean and SEM are shown. p-values are indicated, ANOVA. E. Flow cytometry was used to evaluate RORγt and Foxp3 expression and IL-17 and IFNγ cytokine production in live, CD4+ T cells from the colonic lamina propria. F,G. IL10−/− mice mono-associated with AIEC isolate 2A were treated with anti-IL23 or isotype control on day 1 and 4 following DSS exposure. F. Percent survival following DSS administration is shown. Isotype N = 8, anti-IL-23 N = 8. Log rank test, P<0.05. G. Flow cytometry was used to evaluate RORγt and Foxp3 expression and IL-17 and IFNγ cytokine production in live, CD4+ T cells from the colonic lamina propria. Mean percentages are shown for each experimental group (N=5) and error bars reflect SEM. Data are from one of three independent experiments. P-values are indicated, ANOVA.

