
Figure 4. Polarization of cadherin fingers requires continued Arp2/3-driven actin polymerization and asymmetric actomyosin contractility.
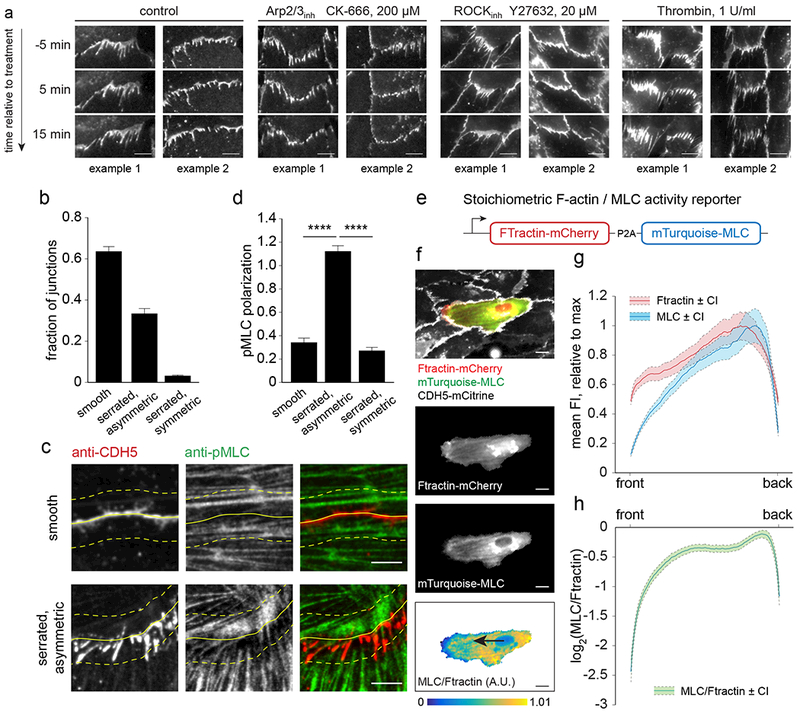
(a) HUVEC expressing CDH5-mCitrine were control treated or treated with an Arp2/3 inhibitor (CK666, 200 μM), a ROCK inhibitor (Y27632, 20 μM), or Thrombin (1U/ml) during the acquisition of time-lapse sequences. Cadherin fingers were lost upon Arp2/3 and ROCK inhibition, whereas Thrombin treatment caused cadherin fingers to point both ways. (b-d) Asymmetric phospho-myosin light chain (pMLC) distribution at asymmetric cell-cell junctions. (b) The fraction of (i) smooth, (ii) serrated/asymmetric and (iii) serrated/symmetric cell-cell contacts in HUVEC fixed and stained with phalloidin/anti-pMLC/anti-CDH5. 916 cell-cell junctions were analyzed, bars are means ±S.D. from n=3 independent experiments. (c-d) In serrated, asymmetric cell-cell contacts of control cells, pMLC signal was enriched near where cadherin fingers originated in the donor cells and locally depleted near incoming cadherin fingers in the acceptor cell. No gradients in pMLC signal could be observed in smooth contacts. Solid yellow lines indicate cell boundaries, dashed lines outline regions where pMLC signal was enriched/depleted in case of serrated/asymmetric, but not smooth cell-cell contacts. (d) pMLC intensity in two areas on opposite sides of smooth, serrated asymmetric, or serrated symmetric cell-cell contacts was measured and a normalized ratio expressed as pMLC polarization. Bars are means ±S.E.M. from n=52 measurements per junction type, pooled from two independent experiments. **** p<0.0001, Kruskal Wallis ANOVA/Dunn. (e) Schematic of the stoichiometric F-actin (Ftractin-mCherry) and myosin II activity (mTurquoise-MLC) reporter used. (f-h) Mosaic experiment of cells either expressing CDH5-mCitrine alone or coexpressing CDH5-mCitrine and Ftractin-mCherry-P2A-mTurquoise-MLC to determine front-back activity profiles of myosin activity in migrating cells. Time-lapse sequences acquired at 5 min intervals were used to track cells expressing Ftractin-mCherry-P2A-mTurquoise-MLC for 45 min. (f) Example of a cell expressing Ftractin-mCherry-P2A-mTurquoise-MLC surrounded by CDH5-mCitrine expressing cells. Masking was done based on Ftractin-mCherry signal and the relative myosin II activity calculated as the ratio of mTurquoise-MLC and Ftractin-mCherry intensities. (g,h) Front-back profiles of Ftractin-mCherry, mTurquoise-MLC, and the ratio mTurquoise-MLC/Ftractin-mCherry show a depletion of myosin activity in the front. Mean profiles ±95% confidence intervals from n=181 cells, pooled from two independent experiments. Scale bars, 10 μm