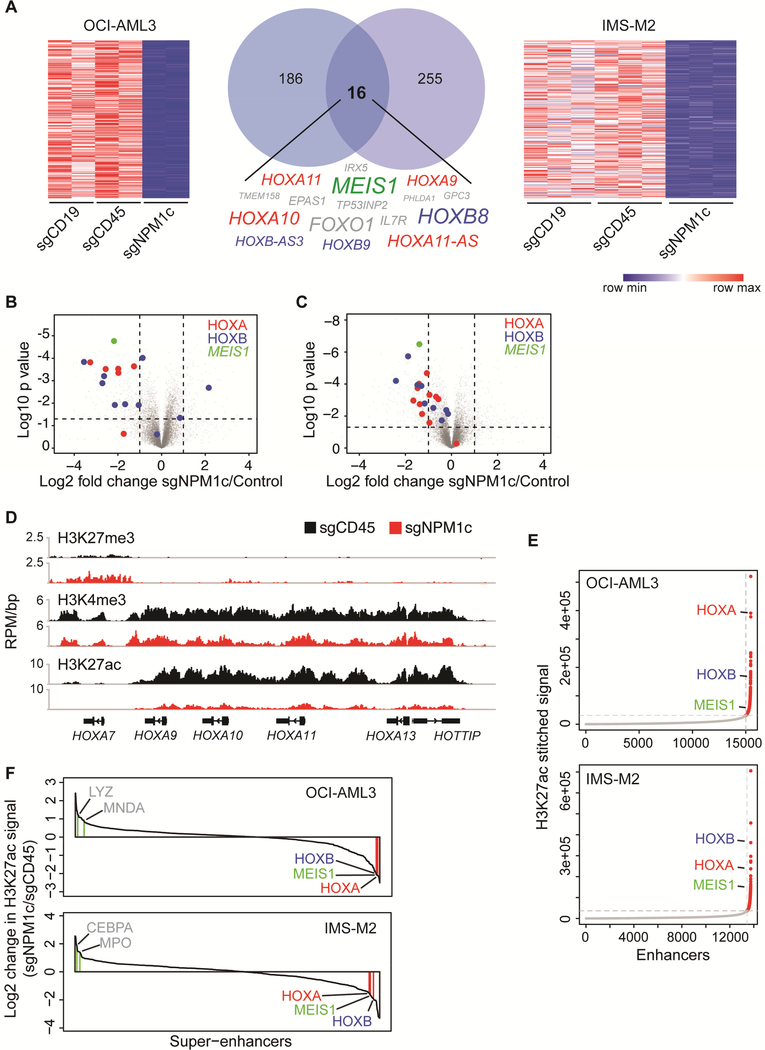
Figure 5. Nuclear relocalization of NPM1c induces HOX/MEIS1 downregulation.
(A) Heatmaps and Venn diagram showing genes downregulated >2 fold (p<0.01) in OCI-AML3 and IMS-M2 cells 3 days after transfection with sgNPM1c, compared to control sgRNAs (sgCD19 and sgCD45). The 16 genes downregulated in both cell lines are listed. Size of text corresponds to significance of downregulation. (n=2 for OCI-AML3, n=3 for IMS-M2; p value derived from two-tailed Student’s t-test).
(B) Volcano plots depicting differentially expressed genes in OCI-AML3 cells transfected with sgNPM1c compared with control sgRNAs. (n=2; p value derived from two-tailed Student’s ttest).
(C) Volcano plot depicting differentially expressed genes in IMS-M2 cells transfected with sgNPM1c compared with control sgRNAs. (n=3; p value derived from two-tailed Student’s ttest).
(D) Gene track view of H3K27me3, H3K4me3, and H3K27ac ChIP-seq signal at distal HOXA locus 3 days after transfection of sgCD45 (black) or sgNPM1c (red) into OCI-AML3 cells.
(E) Enhancers in OCI-AML3 or IMS-M2 cells ranked by increasing H3K27ac signal. The cut-off discriminating typical enhancers (grey) from super-enhancers (red) is depicted with vertical and horizontal dashed lines.
(F) Waterfall plot depicting change in H3K27ac ChIP-seq signal at super-enhancers 3 days after transfection of sgNPM1c or sgCD45 control in OCI-AML3 and IMS-M2 cells. Genes associated with myeloid differentiation are depicted in grey. See also Figure S5 and Table S5.

