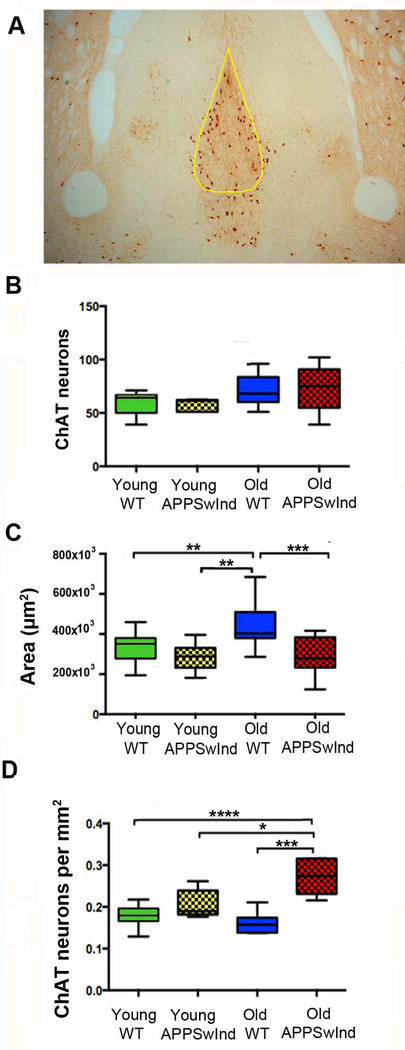
Figure 8. Cholinergic neuron differences in the MSN.
(A) Representative histological section through the MSN stained for choline-acetyl transferase (ChAT), with yellow outline indicating the region used for counts (0.38 mm anterior to bregma).
(B) Counts of ChAT-stained neurons in the MSN, 90.3–0.4 anterior to bregma, of young WT (4–8 months old, n = 15), young APPSwInd (5–6 months old, n=11), old WT (1013–17 months old, n = 7) and old APPSwInd (1317 months old, n = 8) mice. Cross-hatch pattern indicates APPSwInd expressors. No significant difference was found between cohorts.
(C) The area of the MSN is significantly diminished in APPSwInd compared to young and old WT. (** p≤0.006; *** p≤0.001).
(D) ChAT neuron density calculated from the numbers of neurons as in (B) divided by the area of the MSN as in (C) demonstrates significantly increased density of ChAT neurons in the APPSwInd mice compared to young or old WT. * p≤0.04, *** p≤0.0001, **** p≤0.0001. Statistics represent mixed model ANOVA, with Tukey’s post-hoc test. Error bars are represented as SEM.

