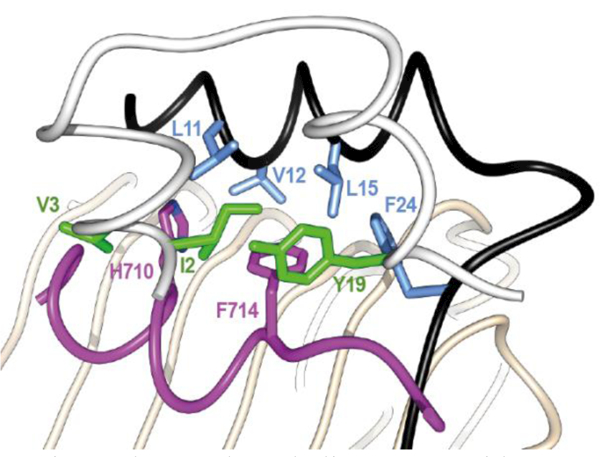
Figure 14.

Details of the interaction of αCT residue His710 and Phe714 with the hormone core. The insulin A chain is in white with green side chains, the B chain is in black with light blue side chains. The receptor L1 domain is in tan and the receptor αCT helix is in magenta. The schematic is based on PDB entry 4OGA [41].
