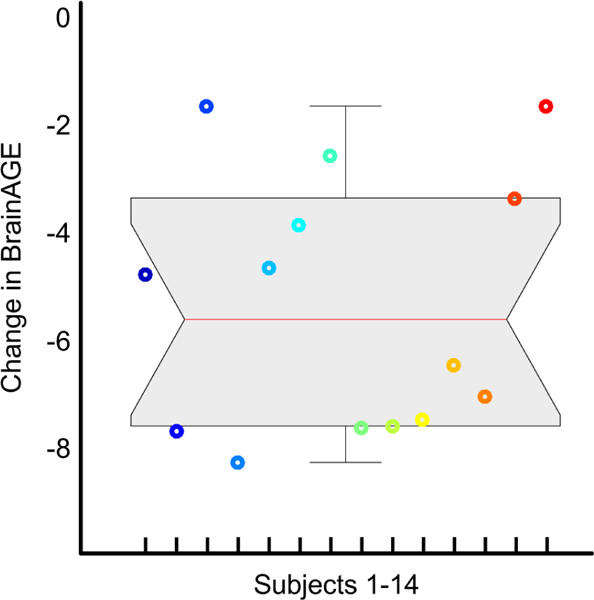
Figure 1.

Change in BrainAGE (in years) between Early and Late Postpartum. The data are displayed as a boxplot, with the gray shaded area containing the values between the 25th and 75th percentiles of the sample (the red line indicates the median; the two short black lines the 1.5 interquartile ranges). Negative numbers show that brains were estimated younger at late postpartum than at early postpartum. The 14 different colors refer to the 14 individuals.
