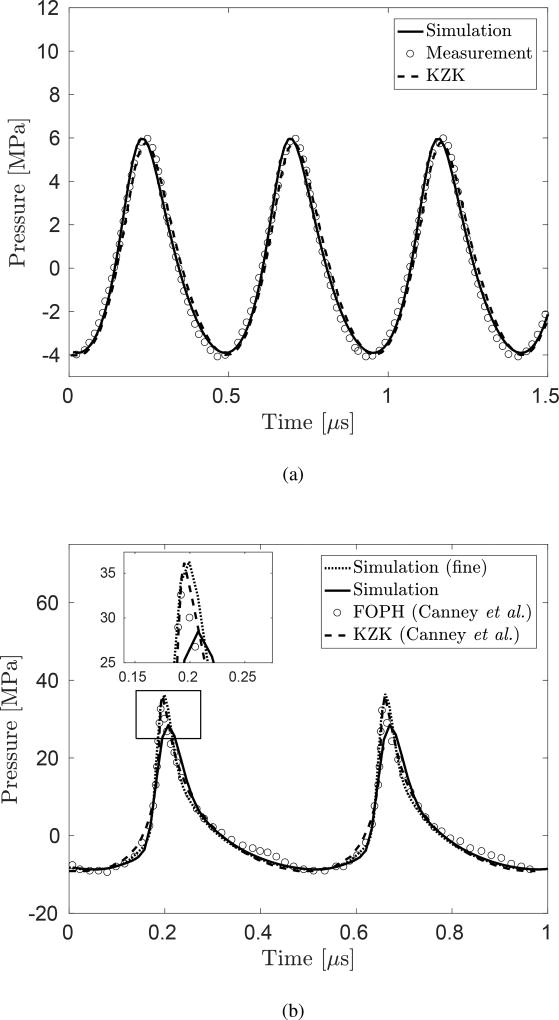
Figure 4.
The focal pressure evolutions in water with (a) pa = 1.0 × 10⁵ and (b) pa = 2.9 × 10⁵. In the plot (a), the result of the direct numerical simulation (−), FOPH measurement by Canney et al (◦) [13], and analytical solution calculated with the KZK equation presented in Canney et al [13] (- -) are compared. In the plot (b), the results of the direct numerical simulation with a cell size of Δx = Δy = 12.5 µm (- -) and Δx = Δy = 20 µm (−) are compared with FOPH measurement and analytical solution calculated with the KZK equation.

