
Figure 1. Structural Equation Model Solution with Standardized Measurement Weights and Structural Parameters.
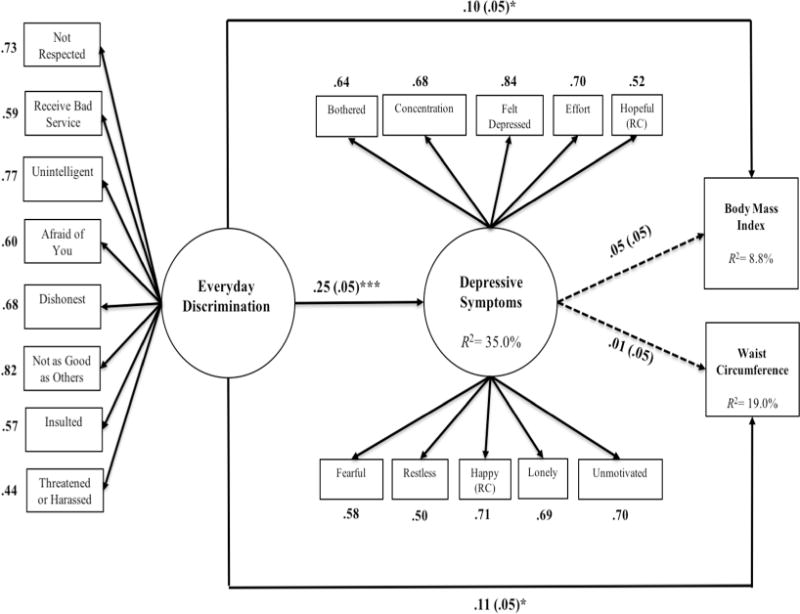
Note. RC= Reverse Coded. Dashed lines represent non-significant structural paths. Values in parentheses represent standard errors. Covariance between errors for body mass index and waist circumference not represented in model (β= .89, p< .001). The model was adjusted for age, gender, birthplace, employment status, perceived income, physical activity, and stressful life events. *p < .05; ***p < .001