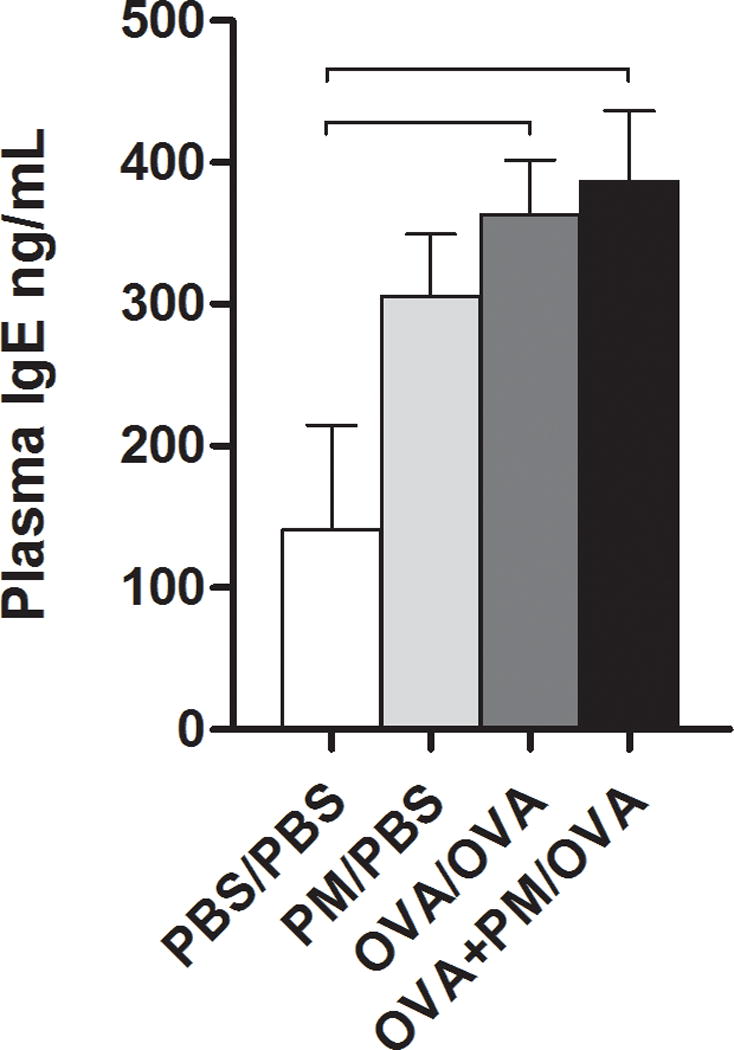
Figure 4.

Immunoglobulin E (IgE) levels from blood plasma of mice sensitized/challenged with PBS/PBS, PM/PBS, OVA/OVA, or OVA+PM/OVA. Concentration is shown as nanograms (ng) of IgE per milliliter (ml) plasma. Data is presented as mean ± SEM (n = 3-5 mice per group). Bars indicate a significant difference of p < 0.05 between groups.
