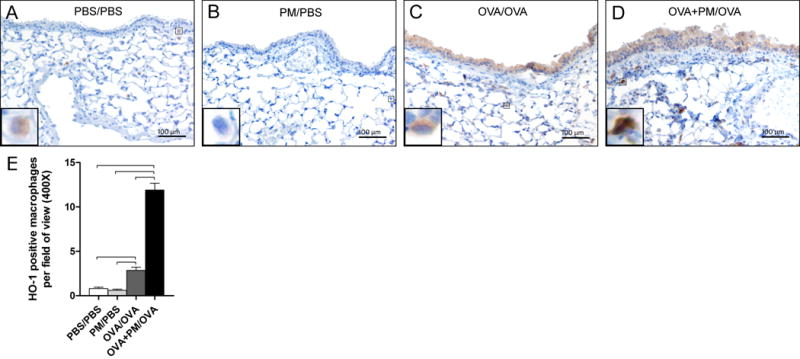
Figure 5.

Hemeoxygenase-1 (HO-1) analysis. (A-D) Micrographs of paraffin embedded lung tissue sections immunohistochemically stained with HO-1 (brown stain, 200x magnification). The inserts show magnified macrophages within the respective image. The scale bar represents a distance of 100 micrometers. (E) The frequency of HO-1 positively stained alveolar macrophages in one total field of view (400x). Data is presented as mean ± SEM (n = 5-6 mice per group). Bars indicate a significant difference of p < 0.05 between groups.
