
Figure 1: Elevated Casp2 expression in ER-stressed mice and human NASH.
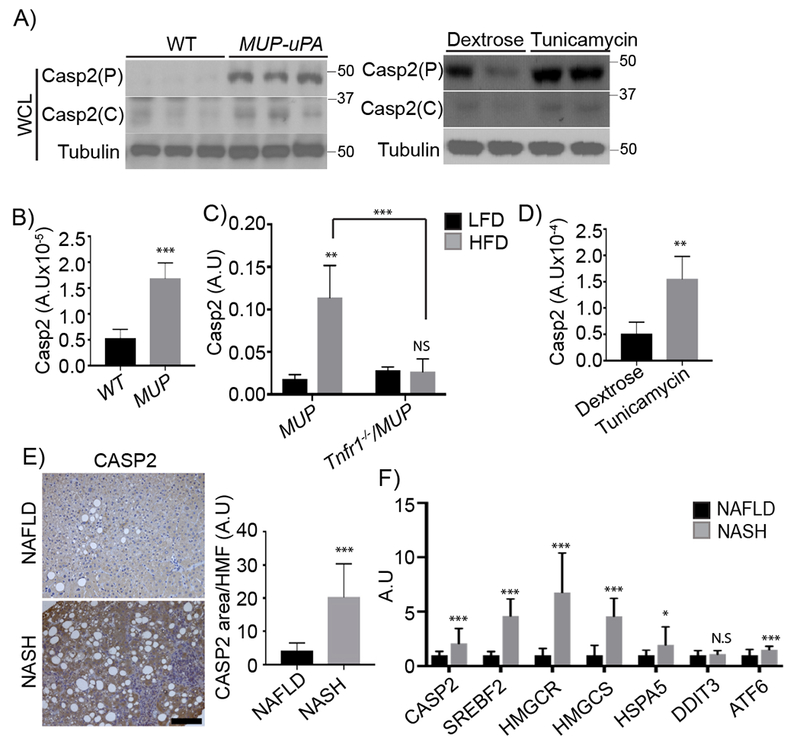
A) Immunoblots (IBs) analysis of whole cell lysates (WCL) from 5-week-old WT and MUP-uPA livers (left) and 3-month-old WT livers exposed to dextrose or tunicamycin. Mean ± SEM (dextrose: n = 4; tunicamycin: n = 5). P: precursor, C: cleaved. B) Casp2 mRNA in livers of above 5-week-old mice quantified by qRT-PCR. Results are mean ± SEM (WT: n = 5; MUP: n = 9). C) Liver Casp2 mRNA in 20-week-old MUP-uPA and Tnfr1−/−/MUP-uPA mice given HFD for 12 weeks. Mean ± SEM [MUP (LFD: n = 4; HFD: n = 8); Tnfr1−/−/MUP (LFD: n = 4; HFD: n = 9)]. D) Liver Casp2 mRNA induction by tunicamycin; mean ± SEM (dextrose: n = 4; tunicamycin: n = 5). E) CASP2 immunohistochemistry (IHC) of liver biopsies from NAFLD (n = 4) and NASH (n = 4) patients. Staining intensity was quantified by ImageJ. F) CASP2, SREBF2, HMGCR, HMGCS, and ER stress marker transcripts (HSPA5, DDIT3 and ATF6) in liver biopsies from NAFLD (n = 10) or NASH (n = 9) patients quantified by qRT-PCR. *p < 0.05, **p < 0.005, ***p < 0.001. A.U., arbitrary units.