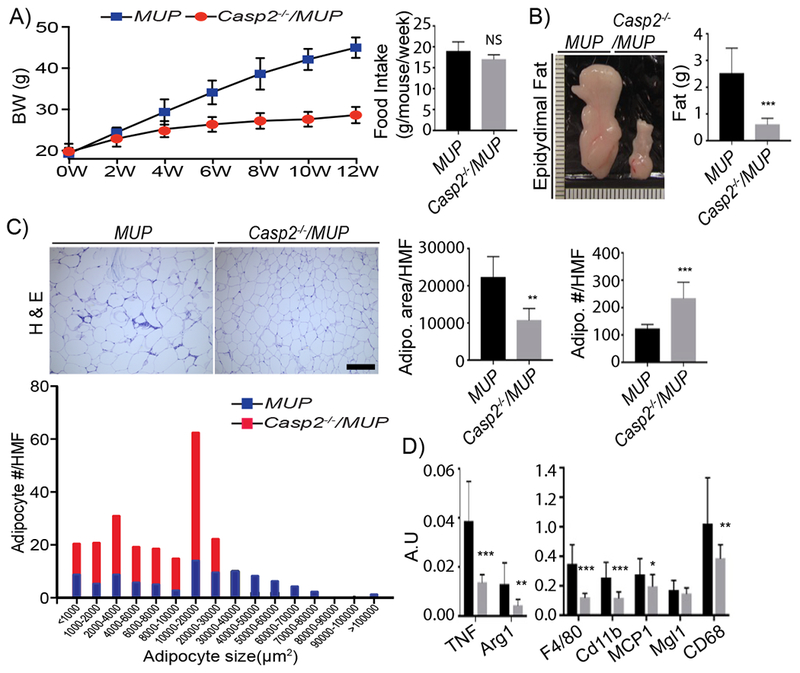
Figure 3: Casp2 controls adipose tissue expansion.

A) Body weight and bi-weekly food intake of indicated mouse strains given HFD (MUP: n = 12; Casp2−/−/MUP: n = 10). Mean ± SEM. B) Gross morphology and epidydimal fat weights from above mice (MUP: n = 12; Casp2−/−/MUP: n = 10). C) H&E stained FFPE epidydimal fat sections. Scale bar: 200 μm. Adipocyte area/HMF, adipocyte number/HMF and adipocyte size distributions were determined by ImageJ of 5 HMF per section (MUP: n = 7; Casp2−/−/MUP: n = 9). D) Cytokine and inflammation marker mRNAs were quantified by qRT-PCR analysis of epidydimal fat RNA. Bar graphs: mean ± SEM. *p < 0.05, **p < 0.005, ***p < 0.001.
