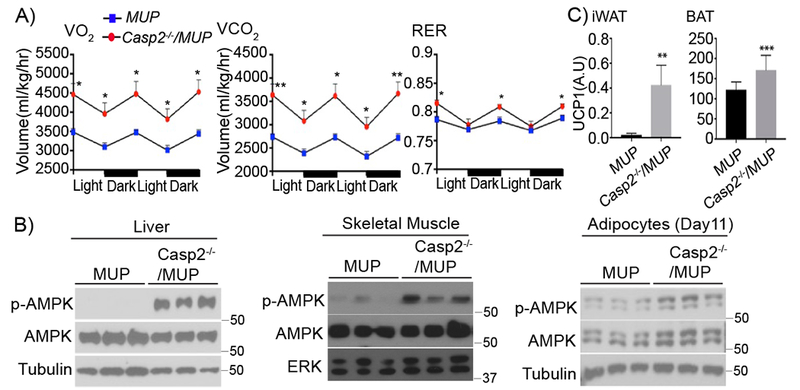
Figure 4: Casp2 ablation increases energy expenditure.

A) VO2, VCO2, and RER measurements in indicated mouse strains given HFD for 12 weeks and kept in metabolic cages for 2 dark and light cycles (n = 6 per group). Mean ± SEM. B) IB of p-AMPK and AMPK in tissue extracts from indicated mouse strains. C) UCP1 mRNA in inguinal fat (iWAT) and brown adipose tissue (BAT) of indicated mouse strains determined by qRT-PCR analysis (MUP: n = 12; Casp2−/−/MUP: n = 10). Mean ± SEM. *p < 0.05, **p < 0.005, ***p < 0.001.
