
Figure 2.
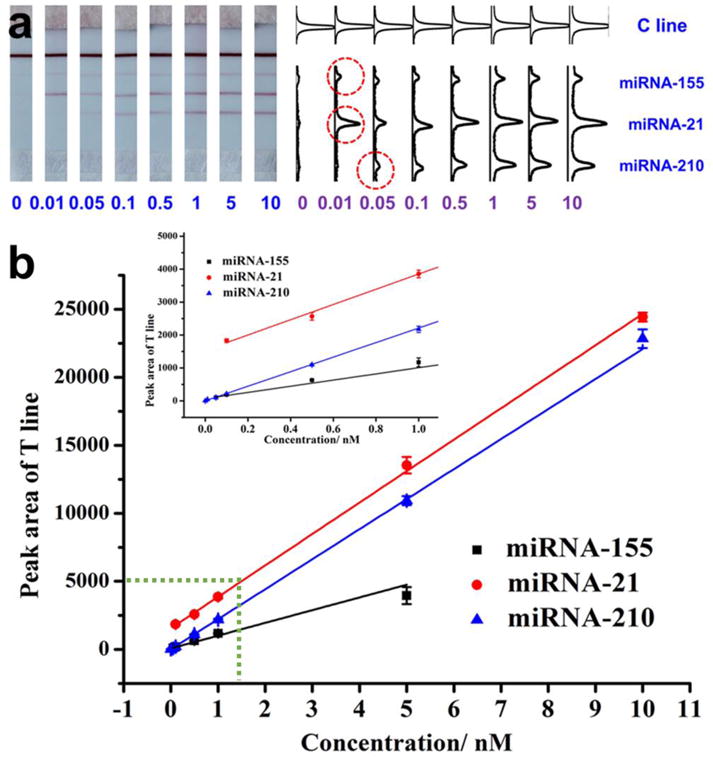
(a) Typical photo images of LFNABs in the presence of different concentrations of miRNA-21. (b) Corresponding optical responses; (c) Calibration curves of detecting individual miRNA on LFNAB.
Official websites use .gov
A
.gov website belongs to an official
government organization in the United States.
Secure .gov websites use HTTPS
A lock (
) or https:// means you've safely
connected to the .gov website. Share sensitive
information only on official, secure websites.
(a) Typical photo images of LFNABs in the presence of different concentrations of miRNA-21. (b) Corresponding optical responses; (c) Calibration curves of detecting individual miRNA on LFNAB.