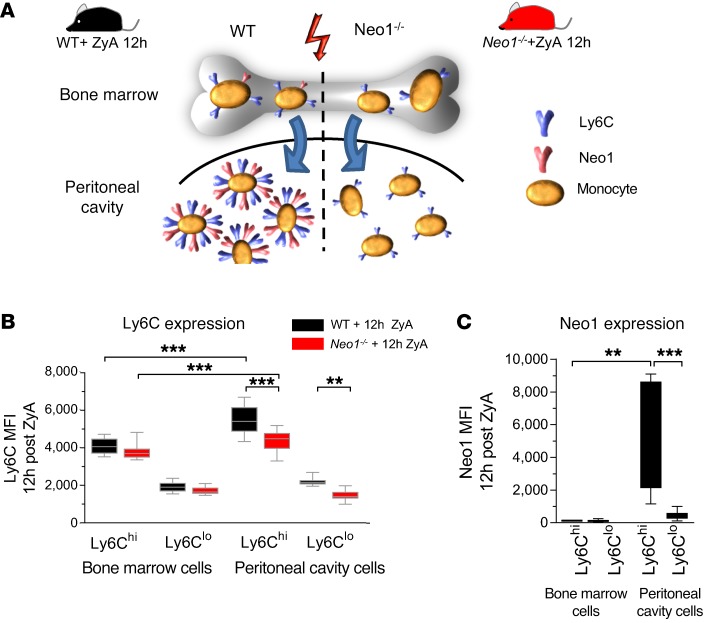
Figure 3. Neo1-dependent monocyte intracellular signaling.
WT and Neo1–/– bone marrow monocytes and WT and Neo1–/– peritoneal monocytes were collected 12 hours after ZyA injection. (A) Schematic illustration of maturation patterns in WT and Neo1–/– monocytes. (B) Ly6C expression and (C) Neo1 expression in bone marrow monocytes and peritoneal monocytes were determined by flow cytometry. The results represent 2 independent experiments and are expressed as median ± 95% CI (n = 8–12 per group). Statistical analysis was done by 1-way ANOVA followed by Bonferroni’s post hoc test, *P < 0.05, **P < 0.01, ***P < 0.001.

