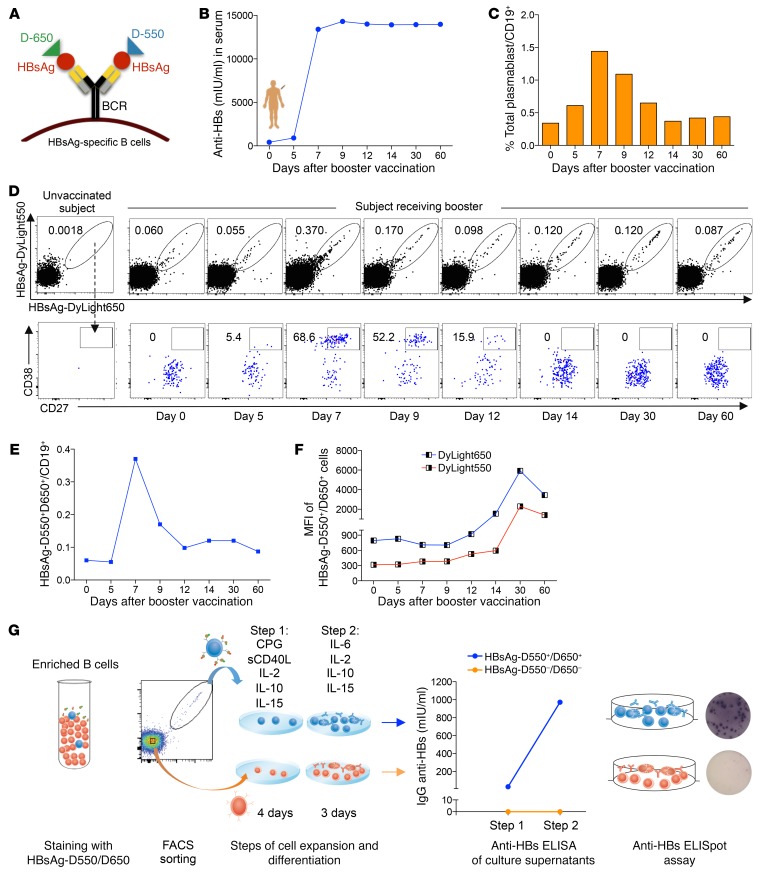
Figure 1. Fluorescently labeled HBsAg baits bind specifically to HBsAg-specific B cells.
(A) Schematic representation of fluorescently labeled HBsAg baits binding to the BCR on the surface of HBsAg-specific B cells. A healthy subject received an HBV booster vaccination. Serum and blood samples were analyzed from day 0 to day 60 after vaccination. (B) Anti-HBs titers in the serum from day 0 to day 60 after vaccination. (C) Frequency of total plasmablasts (CD19+CD10–CD21–/loCD27++CD38++) out of total B cells measured longitudinally. (D) Flow cytometry plots show the frequency of HBsAg double-binding MBCs (top panel) and their percentages displaying a plasmablast phenotype (bottom panel). The first plot at the left shows data of a healthy unvaccinated subject. The other plots show data of a healthy vaccinated subject at the indicated time points before and after the HBV booster vaccination. (E) Frequency of HBsAg double-binding MBCs over time. (F) MFI of HBsAg-D550 and HBsAg-D650 on HBsAg-specific B cells at different time points. (G) Equal numbers of HBsAg-D550+D650+ and HBsAg-D550–D650– MBCs were FACS sorted from PBMCs of day 60 after booster vaccination and triggered for Ab production by CpG and sCD40L polyclonal activation. Cells were cultured in 2 different steps with different cytokine mixtures. Subsequently, anti-HBs ELISA and anti-HBs ELISpot assays were performed on culture supernatants and on the cells, respectively.

