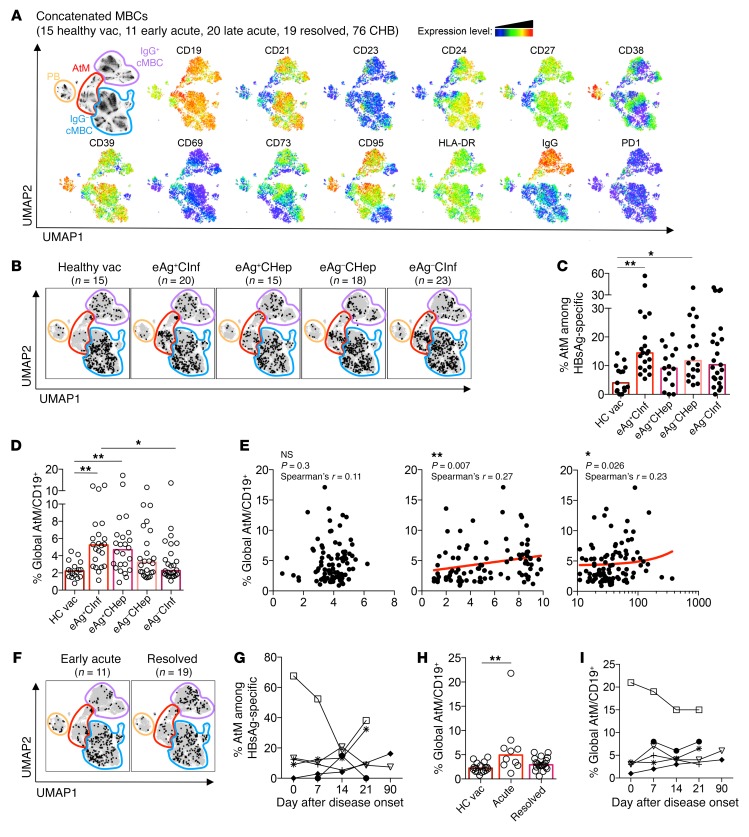
Figure 6. HBsAg-specific and global B cells of CHB patients are enriched for an AtM phenotype.
(A) Flow cytometric data of MBCs from 15 healthy vaccinated, 11 early acute, 20 late acute, 19 resolved, and 76 CHB patients were analyzed by the dimensionality reduction algorithm UMAP and concatenated. Four different MBC subsets were delineated (left panel) based on the expression heatmaps of 13 markers (right panels). (B) HBsAg-specific B cells from 15 healthy vaccinated, 20 HBeAg+ chronic infection, 15 HBeAg+ chronic hepatitis, 18 HBeAg– chronic hepatitis, and 23 HBeAg– chronic infection patients were concatenated, normalized to their correct frequency, and overlaid onto the UMAP plot of global concatenated MBCs. (C) Frequency of AtM B cells among HBsAg-specific B cells within the different cohorts. (D) Frequency of global AtM B cells among total B cells (CD19+) present in the subjects of the different cohorts. (E) Correlation of frequency of global AtM among total B cells with serum HBsAg (left), HBV DNA (middle), and ALT (right) levels. (F) Overlay of HBsAg-specific B cells on global MBCs of 11 concatenated acute (left) and 19 resolved (right) HBV patients. (G) Percentage of HBsAg-specific B cells with an AtM phenotype in 6 acute HBV patients at different time points from disease onset. Each symbol represents a single patient. (H) Percentage of global AtM B cells among total B cells (CD19+) of healthy vaccinated, acute, and resolved HBV patients. (I) Percentage of global AtM B cells in 6 acute HBV patients at different time points from disease onset. Bar graphs present median, and statistical analysis was performed by the Kruskal-Wallis test followed by Dunn’s multiple comparisons test (C, D, and H) and Spearman’s rank correlation (E). *P < 0.05; **P < 0.01.

