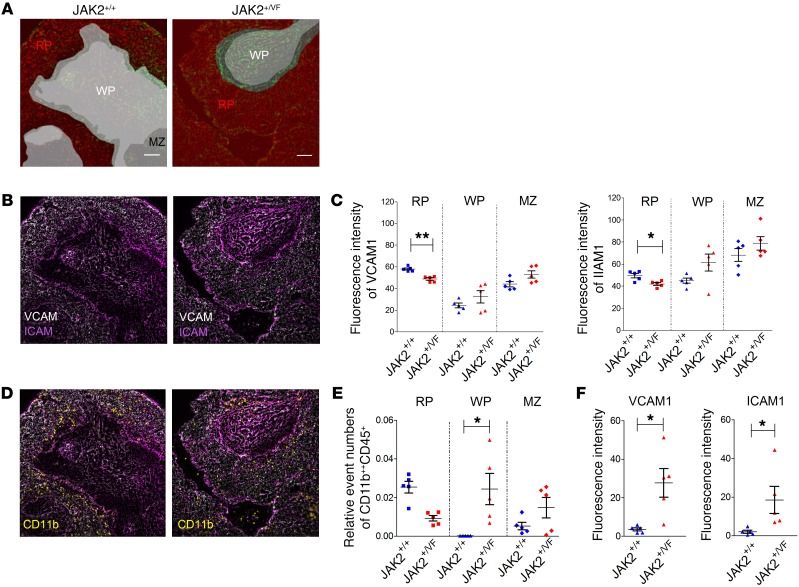
Figure 6. MELC of JAK+/+ and JAK2+/VF spleens.
(A) Segmentation of JAK2+/+ (n = 5) and JAK2+/VF (n = 5) splenic tissue of into red pulp (RP), white pulp (WP), and marginal zone (MZ) based on the signals of VCAM1 and ICAM1. Scale bars: 50 μm. (B) Fluorescence signal of VCAM1 (white) and ICAM1 (magenta) for JAK+/+ and JAK2+/VF spleen. (C) MFI of VCAM1 (left panel) and ICAM1 (right panel) for the regions defined in A. (D) The fluorescence signal of VCAM1 and ICAM1 was overlaid with the neutrophil marker protein CD11b. (E) Quantification of all neutrophils is depicted within the respective areas of the spleen based on fluorescence data shown in D. (F) MFI of CD11b signals in defined small objects that directly interact with VCAM1 (left panel) or ICAM1 (right panel). The definition of small objects is described in Supplemental Figure 5. An overlap of any small object of more than 0% and less than 20% with the regions positive for VCAM1 or ICAM1 is defined as directly interacting small object. Data were generated from 5 individual fields of view from 3 independent mice for each genotype. Horizontal bars represent the mean. *P < 0.05, **P < 0.01 (unpaired, 2-tailed Student’s t test).

