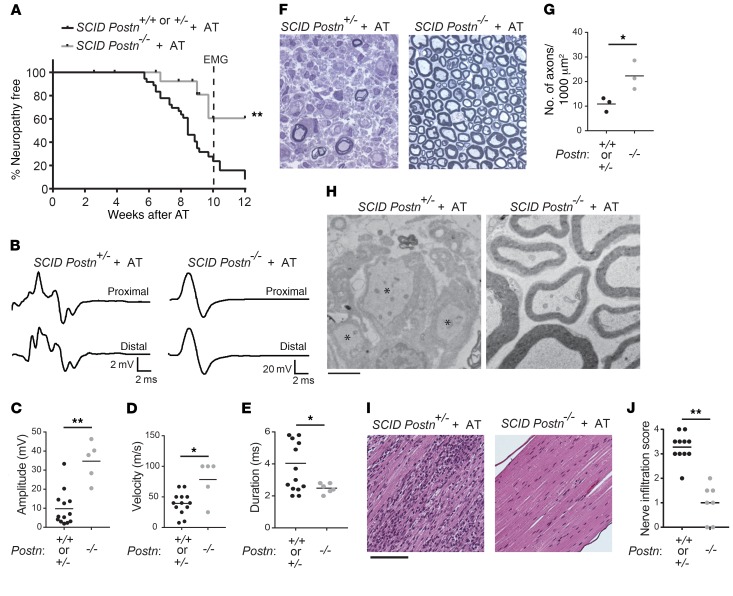
Figure 3. Postn deficiency protects against neuropathy.
NOD.SCIDPostn+/+, NOD.SCIDPostn+/–, and NOD.SCIDPostn–/– mice after AT with NOD.AireGW/+ activated splenocytes. NOD.SCID Postn–/– mice were compared with NOD.SCID Postn+/+ and NOD.SCID Postn+/– mice. (A) Neuropathy incidence curve shows the onset of clinical symptoms. Dotted line represents the time point at which mice were used in experiments (10 weeks after AT). (B) Representative CMAP traces 10 weeks after AT. The CMAP of the NOD.SCID Postn+/– nerve had a smaller amplitude and was more dispersed than that of the NOD.SCID Postn–/– nerve (note the difference in the y-axis scale: 2 vs. 20 mV). (C) Peak amplitude, (D) conduction velocity, and (E) duration of CMAPs for mice in A. Each dot represents an individual mouse. (F) Representative images of semithin sections of sciatic nerves from NOD.SCID Postn+/– (n = 8) and NOD.SCID Postn–/– (n = 3) recipients of NOD.AireGW/+ activated splenocytes. Original magnification, ×100. (G) The number of myelinated axons/1,000 μm2 was counted in cross sections of tibial nerves from NOD.SCID Postn+/– and NOD.SCID Postn–/– AT recipients. (H) EM images. Demyelinated axons (indicated by asterisks) were observed in the NOD.SCID Postn+/– nerve (n = 8), whereas the NOD.SCID Postn–/– (n = 3) nerve looked normal. Scale bar: 2 μm. (I) H&E staining of sciatic nerves. The NOD.SCID Postn+/– nerve was heavily infiltrated by hematoxylin-positive nuclei compared with the NOD.SCID Postn–/– nerve. Scale bar: 12 μm. (J) Infiltration scores were assigned as follows: 0 = no infiltration; 1 = 1%–25% of the nerve was infiltrated; 2 = 26%–50% of the nerve was infiltrated; 3 = 51%–75% of the nerve was infiltrated; 4 = 76%–100% of the nerve was infiltrated. Each dot represents an individual mouse. *P < 0.05 and **P < 0.005, by log-rank test (A), 2-tailed, unpaired t test with Welch’s correction (C–E and G), or Fisher’s exact test (J).

