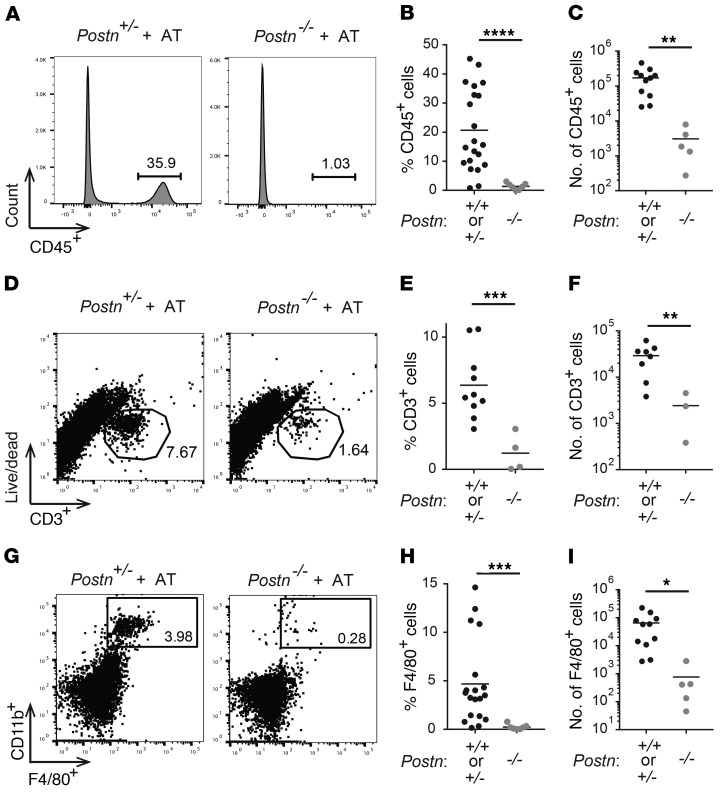
Figure 4. Postn-deficient mice have fewer infiltrating T cells and macrophages.
Flow cytometry was used to evaluate the immune cell infiltrate of sciatic nerves from NOD.SCID Postn+/+, NOD.SCID Postn+/–, and NOD.SCID Postn–/– mice 10 weeks after AT with NOD.AireGW/+ activated splenocytes. (A) Representative histograms of CD45 staining. (B) Frequency and (C) total number of CD45+ cells. (D) Representative dot plots of CD3+ versus live/dead staining. (E) Frequency and (F) total number of CD3+ cells. (G) Representative flow plots of F4/80+ versus CD11b+ staining. (H) Frequency and (I) total number of F4/80+CD11b+ cells. Each dot represents an individual mouse. *P < 0.05, **P < 0.005, ***P < 0.0005, and ****P < 0.0001, by 2-tailed, unpaired t test with Welch’s correction.

