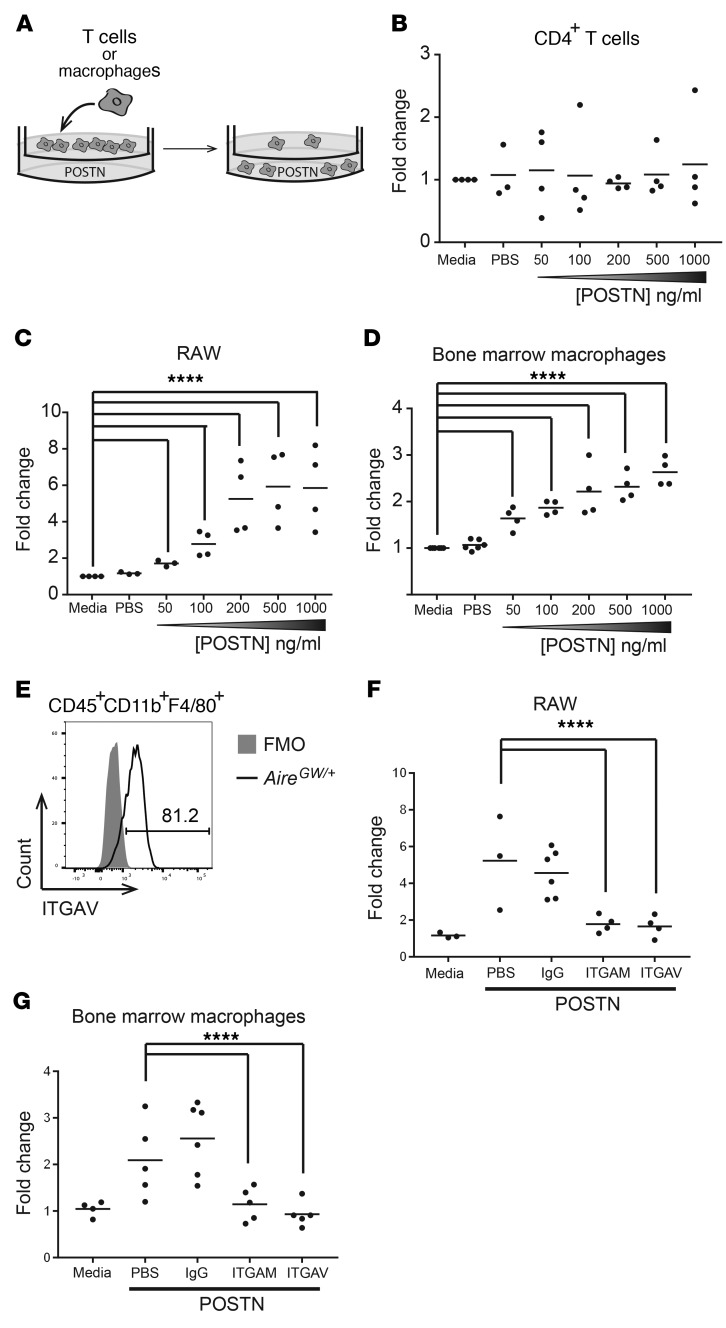
Figure 5. POSTN promotes macrophage chemotaxis via AM and AV integrins.
(A) Transwell migration assay diagram. T cells or macrophages were placed in the upper chamber of a Transwell, and POSTN was placed in the lower chamber. Following a 4-hour (T cells) or 18-hour (macrophages) culture, the number of cells in the bottom chamber was enumerated. The concentration of POSTN was varied from 50 to 1,000 ng/ml. (B) CD4+ T cells isolated from the spleens of neuropathic NOD.AireGW/+ mice were used in a Transwell migration assay as outlined in A. Each dot represents an individual mouse. (C) RAW macrophages were used in a Transwell migration assay. Each dot represents an individual well. (D) Bone marrow was isolated from NOD.AireGW/+ neuropathic mice and grown in the presence of GM-CSF for 5 days to generate bone marrow–derived macrophages, which were used in a Transwell migration assay. Each dot represents an individual mouse. (E) Sciatic nerves from neuropathic NOD.AireGW/+ mice were digested and stained for flow cytometry. A representative histogram of ITGAV expression on CD45+CD11b+F4/80+ macrophages is shown. ITGAV expression was compared with a fluorescence-minus-one (FMO) control. The number represents the frequency of events within the gate. RAW cells (F) or bone marrow–derived macrophages (G) were used in a Transwell migration assay with 100 ng/ml POSTN. IgG isotype control, anti-ITGAM (CD11b), or anti-ITGAV antibodies were included in the top chamber of the Transwell. All values are represented as the fold change compared with media alone. ****P < 0.0001. Statistical analysis was performed in R using the lm() function, where parameters were fit to each mouse as well as the difference in treatment. P values were calculated by comparing the fit of the full model to a model without a term for the difference in treatment and adjusted using Bonferroni’s correction.

