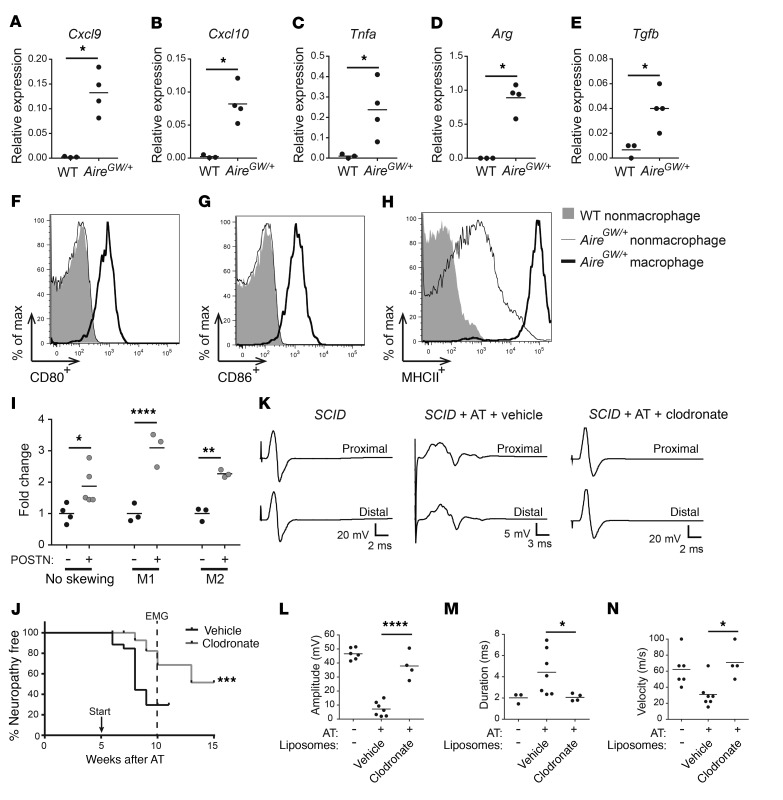
Figure 6. Macrophages promote peripheral neuropathy.
(A–G) RNA was isolated from the sciatic nerves of NOD.WT (WT) mice and from CD3–CD11b+ enriched macrophages from the sciatic nerves of NOD.AireGW/+ neuropathic mice. Cxcl9 (A), Cxcl10 (B), Tnfa (C), Arg (D), and Tgfb (E) expression relative to cyclophilin was measured by qRT-PCR. (F–H) Sciatic nerves from NOD or NOD.AireGW/+ neuropathic mice were digested and stained for flow cytometric analysis. Representative histograms showing CD80+ (F), CD86+ (G), and MHCII+ (H) expression on macrophages and nonmacrophages from NOD or NOD.AireGW/+ neuropathic mice. (I) Macrophages were skewed toward an M1 or M2 phenotype prior to inclusion in a Transwell migration assay; 100 ng/ml POSTN was used in the bottom chamber. All values are represented as the fold change compared with media alone. (J–N) NOD.SCID recipients of NOD.AireGW/+ splenocytes were treated with vehicle or clodronate-containing liposomes weekly starting 5 weeks (arrow) after AT; nerve conductions were done at 10 weeks (dotted line in J). (J) Neuropathy incidence curve shows that fewer clodronate-treated mice developed neuropathy. (K) Representative EMG CMAPs from untreated NOD.SCID mice as well as post-AT NOD.SCID mice treated with vehicle or clodronate liposomes (note the difference in the scale of the y axis: 5 vs. 20 mV). Compared with vehicle, clodronate significantly reduced the CMAP peak amplitudes (L), CMAP durations (M), and conduction velocities (N). Each dot represents an individual mouse. *P < 0.05, **P < 0.005, ***P < 0.0005, and ****P < 0.0001, by 2-tailed t test with Welch’s correction (A–E), log-rank test (J), or ordinary 1-way ANOVA with Tukey’s post hoc test for multiple comparisons (L–N). max, maximum.

