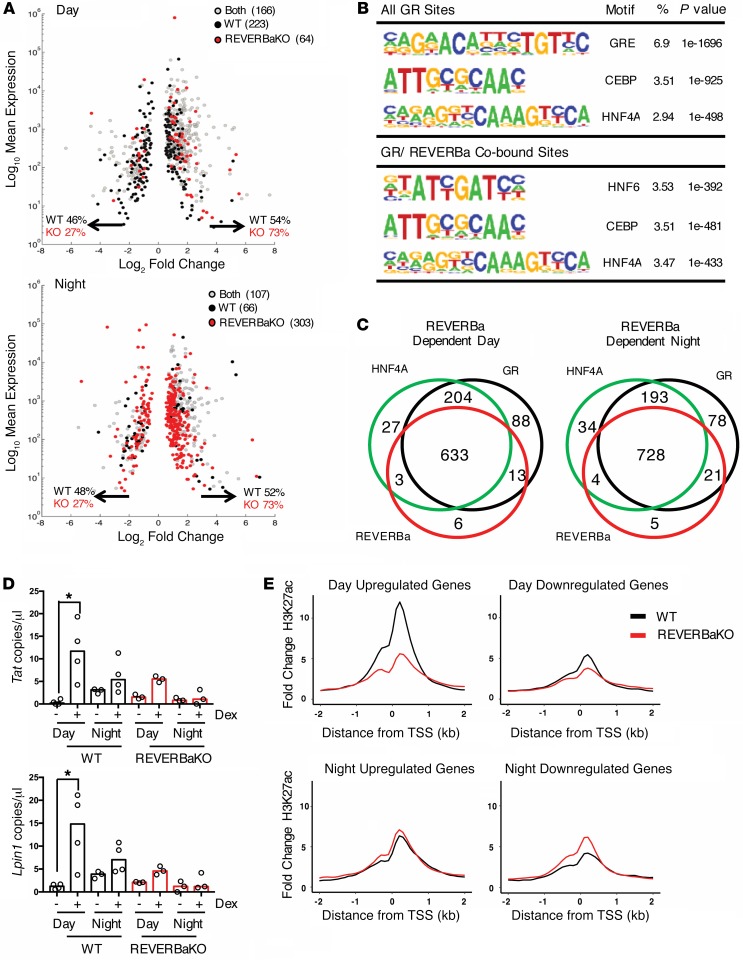
Figure 8. Rhythmicity of GC sensitivity in liver is determined by REVERBa and HNF transcription factors.
(A) Base mean expression versus log2 fold change plots for GC-regulated genes in day and night show direction of gene regulation. (B) Summary of top-ranked motifs (by coverage [%], defined as fraction of observed/expected proportions taken from HOMER output) under all GR peaks or GR/REVERBa co-bound peaks (interpeak distance, <120 bp). (C) Overlay of GC-regulated genes with GR/REVERBa/HNF ChIP-Seq in the day and night. (D) ChIP-PCR for GR-REVERBa target genes in liver associated with carbohydrate (Tat) and lipid ontology (Lpin1) (n = 3–4); graphs show individual values and median. (E) C57BL/6 (WT) and REVERBaKO mice (male and female) were given 1 mg/kg i.p. dex or vehicle at ZT6 or ZT18 for 1 hour; livers were removed and fixed, and chromatin was immunoprecipitated for H3K27Ac (n = 2). Fold change in H3K27Ac coverage from prior to the transcription start site of genes upregulated or downregulated specifically during the day (top), and genes upregulated or downregulated specifically during the night (bottom) in WT and REVERBaKO mice identified from RNA-Seq in Figure 3. Statistical analysis via Mann-Whitney U test (ChIP-PCR), *P < 0.05.

