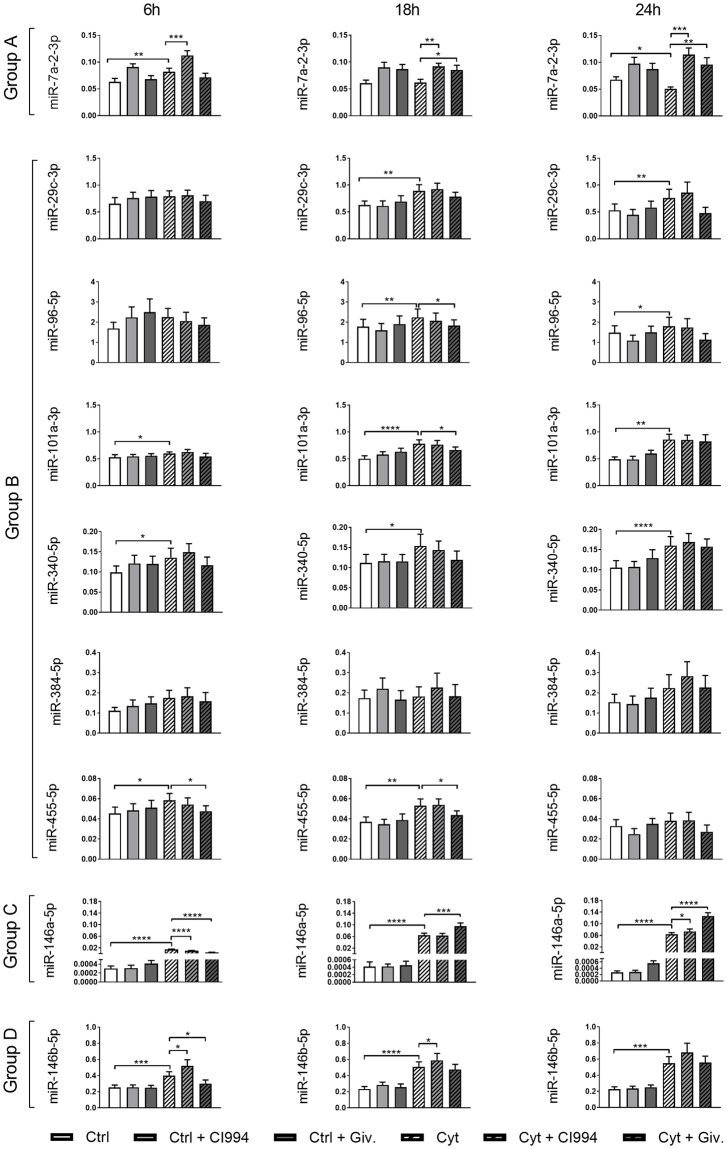
Fig 1. Expression of selected miRs in INS1 cells.
INS1 cells were left untreated, treated with 1 μM of the KDACi CI994 or 125 nM Givinostat (Giv) 1 h prior to the addition of 150 pg/ml IL-1β and 0.1 ng/ml IFN-γ (Cyt) or no cytokines for 6 h, 18 h or 24 h. MiR-enriched total RNA was purified, and the expression of specific miRs was measured with qRT-PCR and normalized to the geometric mean of the housekeeping miRs miR-103a and miR-423. Data are presented as mean ± SEM (n = 9–10) of 2-ΔCT. Statistical significance of a paired t-test is shown in the graphs (*p<0.05, **p<0.01, ***p<0.001 and ****p<0.0001). Group A: miRs were Cyt↓, Giv↑ at 24 h. Group 2: miRs were Cyt↑, Giv↓ at 24 h. Group C: miR was Cyt↑, Giv↑ at 24 h. Group D: miR was Cyt↑, Giv↓ at 6 h.

