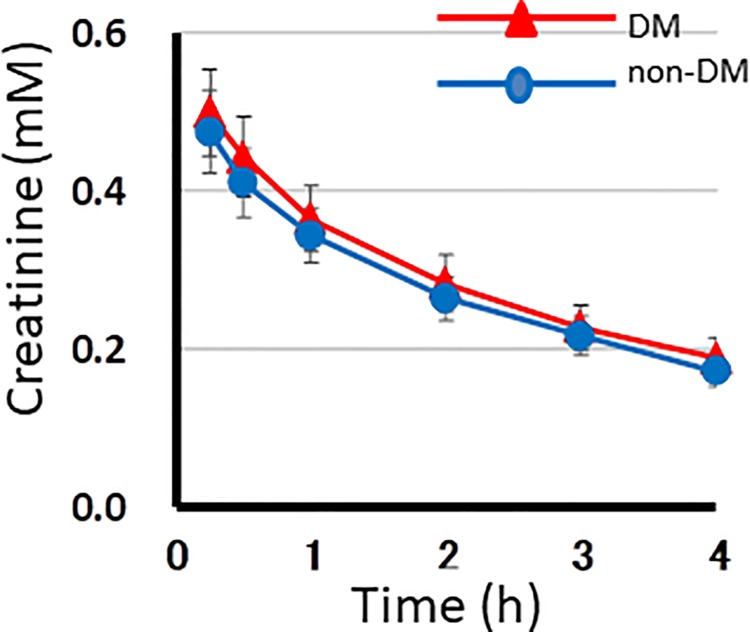
Fig 2. The plasma levels of creatinine during HD in 10 DM and 10 non-DM patients measured by 1H NMR spectroscopy.
In the graph, the x- and y- axes indicate the hours of the HD session and the plasma levels of creatinine (mM), respectively. Red and blue lines represent for DM and non-DM patients, respectively. Dots and vertical bars indicate the mean and SE of 10 patients in each of 5 sessions, respectively.

