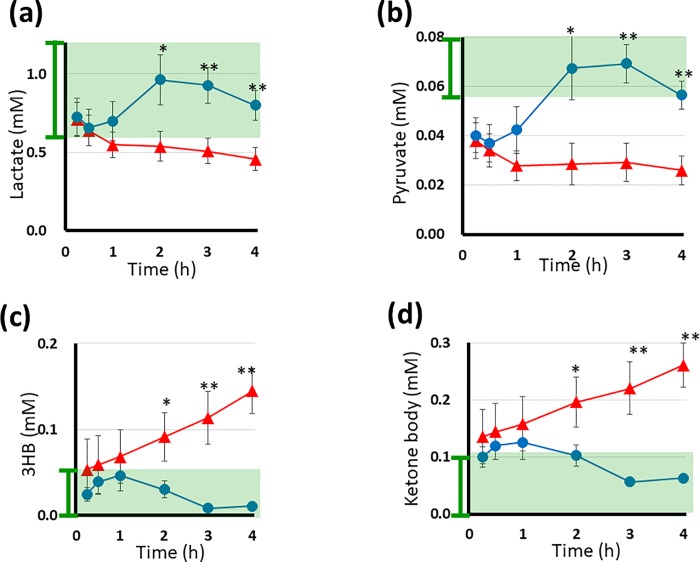
Fig 3.
The plasma levels of lactate (a), pyruvate (b), 3-HB (c) and ketone body (d) during HD in 10 DM and 10 non-DM patients measured by 1H NMR spectroscopy. In each graph, the x-, y- axes, red, blue lines, and dots, vertical bars represented same as the Fig 2, for lactate, pyruvate, 3-HB and ketone body, respectively. Asterisks above the dots indicate statistical significance at P <0.05 (one asterisk) and P <0.01 (double asterisks). The ketone body level is indicated as the sum of 3-HB, acetoacetate and acetone. In the graphs, the normal levels are indicated by green shadow boxes with vertical bars to the left of the y-axis.

