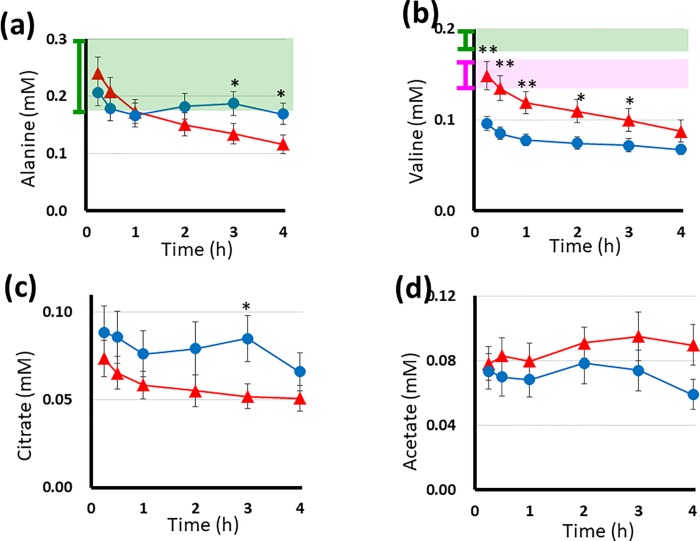
Fig 4.
The plasma levels of alanine (a), valine (b), citrate (c) and acetate (d) during HD in 10 DM and 10 non-DM patients measured by 1H NMR spectroscopy. In each graph, the x-, y- axes, red, blue lines, and dots, vertical bars represented same as the Fig 2, for alanine, valine, citrate and acetate, respectively. Asterisks above the dots indicate the same as in Fig 3. In the graph (a, b), the green shadow boxes are the same as Fig 3. In graph (b), the standard levels obtained from HD patients are indicated as a pink shadow box with a vertical bar to the left of the y-axis. Graphs (c) and (d) show the citrate levels of seven patients and the acetate levels of three patients in both groups who received dialysate without citrate and without acetate, respectively.

