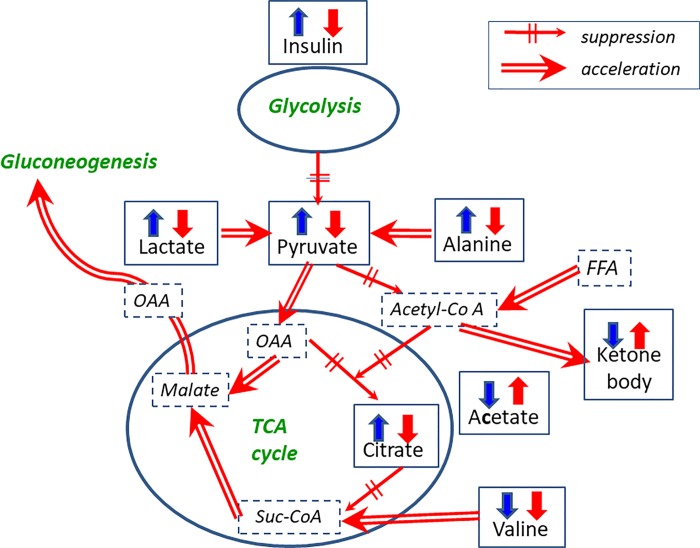
Fig 6. Possible starvation and gluconeogenesis pathways in DM patients.
The measured metabolites and insulin are represented in Gothic letters in boxes. Red and blue arrows show the behaviors of metabolite levels in DM and non-DM patients, respectively. Up and down arrows represent high and low values at later times (2–4 h) during HD, respectively. Detailed time course changes of these levels are presented in Figs 3, 4 and 5. Double arrows and dashed single arrows indicate the acceleration and suppression of flow, respectively. OAA, FFA and Suc-CoA represent oxaloacetic acid, free fatty acid and succinyl Co-A, respectively.

