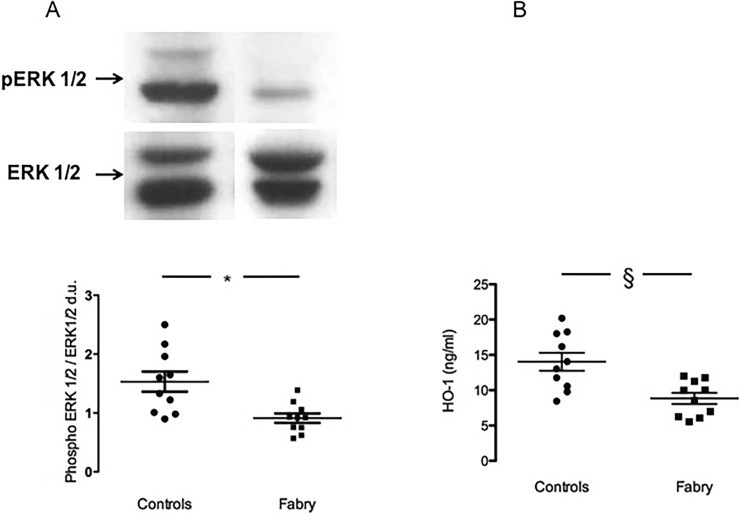
Fig 2.
panel A: ERK 1/2 phosphorylation state. The top of the figure shows representative ERK 1/2 phosphorylation status in Fabry patients (Fabry) and in healthy subjects (Controls). Data are shown ±SEM. *: p = 0.004. panel B: HO-1 protein expression. HO-1 protein concentration (ng/mL). Data are shown ±SEM. §: p<0.02.

