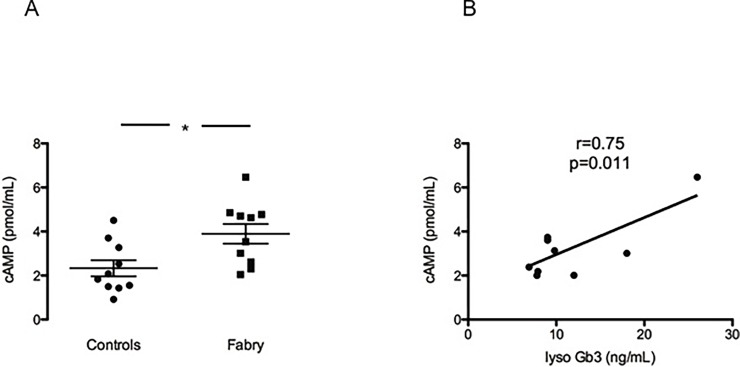
Fig 4. cAMP levels and correlation with LysoGb3.
Panel A shows cAMP levels (pmol/mL) in Fabry subjects (Fabry) compared to controls (Controls) Data are shown ±SEM. *: p = 0.01. In panel B there is a positive correlation between cAMP levels in Fabry patients and their LysoGb3 levels. r = 0.75, p = 0.011.

