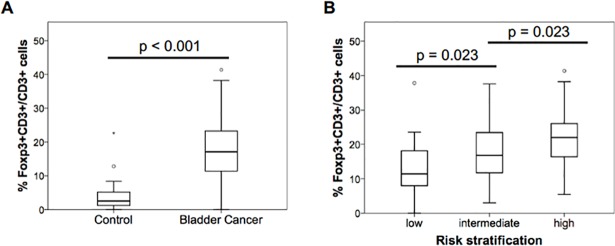
Fig 2. Percentage of Foxp3+CD3+ T cells in TURBT specimens.
(A) Comparison of median (interquartile range) of the percentage of Foxp3+ cells among CD3+ cells in 14 non-bladder cancer controls and 115 TURBT specimens of NMIBC (P < 0.001, Mann-Whitney test). (B) Comparison of median (interquartile range) of the percentage of Foxp3+ cells in CD3+ cells in three risk groups (P < 0.001, Kruskal-Wallis test).

