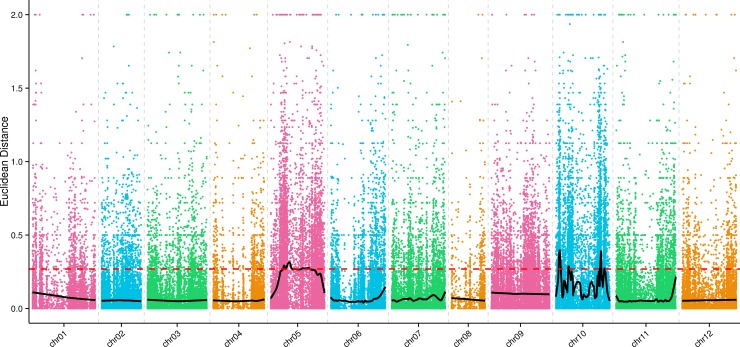
Fig 2. Association values for anthocyanin accumulation on each pepper chromosome from Euclidean distance-based association analysis.
The 12 pepper chromosomes are represented along the x-axis, and the association values based on Euclidean distance (ED) are indicated along the y-axis. ED-based association values at each SNP location are represented by colored dots. The red dashed line represents the association threshold and black line indicates Loess-fitted values. When ED-based association values are higher, stronger association of a SNP with anthocyanin accumulation is indicated.

