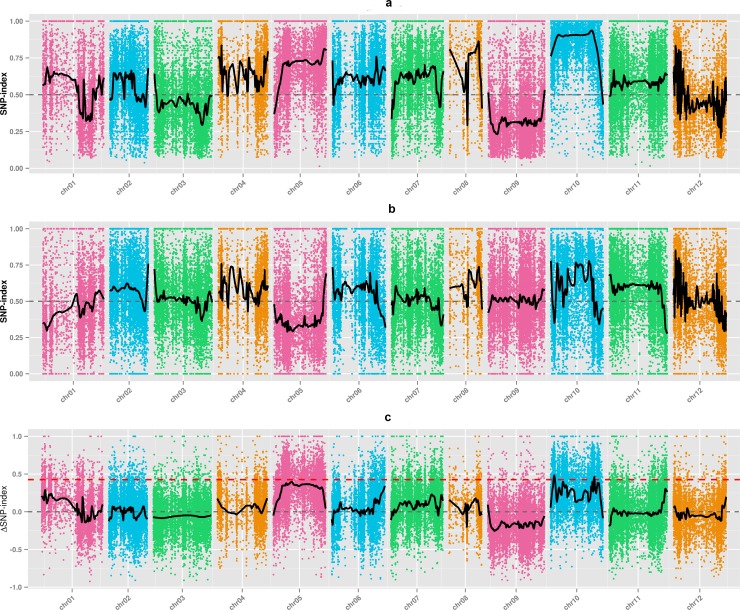
Fig 3.
Graphs of H-pool (a) and N-pool (b) indices and ΔSNP-index (c) for SNP-index-based association analysis. The 12 chromosomes are represented along the x-axis, and the SNP index or ΔSNP-index values are shown along the y-axis. The black line indicates fitted SNP-index or ΔSNP-index values. The red, blue, and green lines indicate the thresholds at the 99%, 95%, and 90% confidence coefficients, respectively.

