Figure 1.

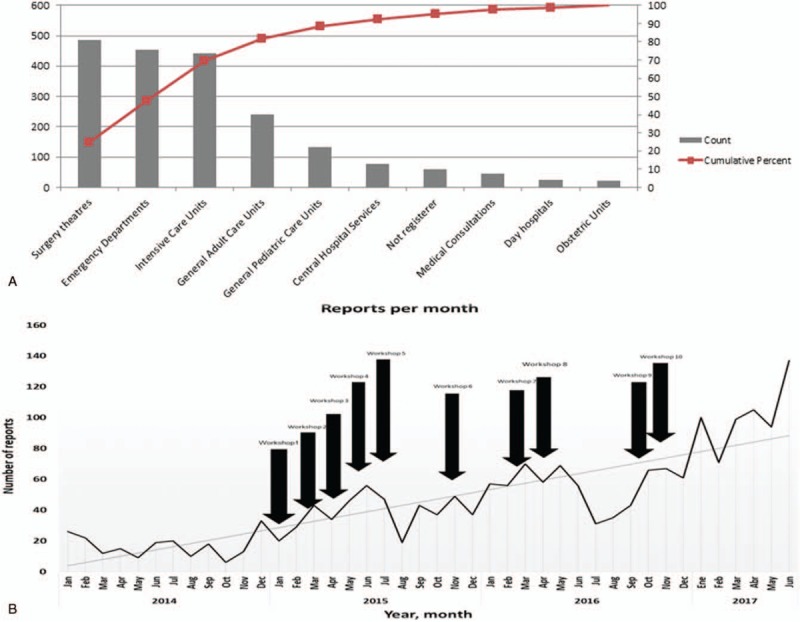
Pareto chart showing areas of hospitalization and patient safety incident frequency (A). Number of reports per month (line) versus training workshops for the local clinical safety leaders (arrows) (B).

Pareto chart showing areas of hospitalization and patient safety incident frequency (A). Number of reports per month (line) versus training workshops for the local clinical safety leaders (arrows) (B).