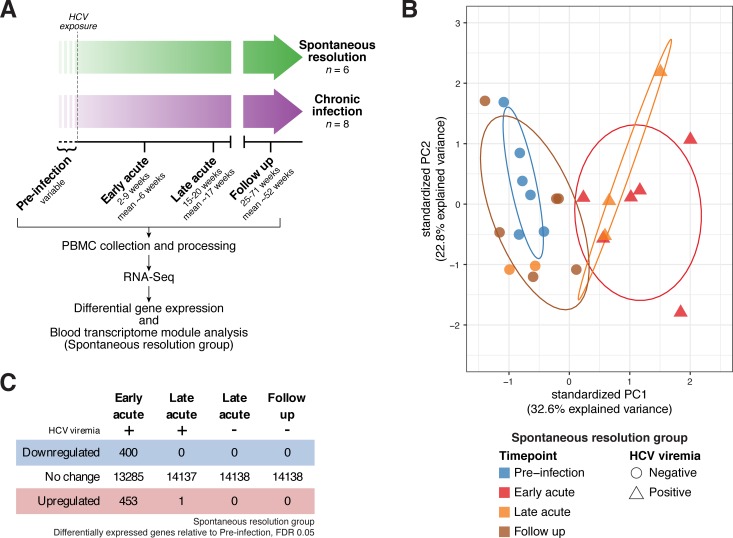
Fig 1. Study design and differential gene expression analysis in the Resolution group.
(A) Overall study design. (B) Principal component analysis (PCA) of gene expression in the Resolution group (patient-specific gene expression variation removed as detailed in Materials and Methods). Color denotes time point, shape denotes HCV viremia status. Ellipses indicate 68% normal probability for each group (for Resolution group, Late Acute timepoint, ellipse plotted for positive HCV viremia samples only). (C) Summary of differential gene expression analysis results in the Resolution group. See also S1 and S2 Tables.

