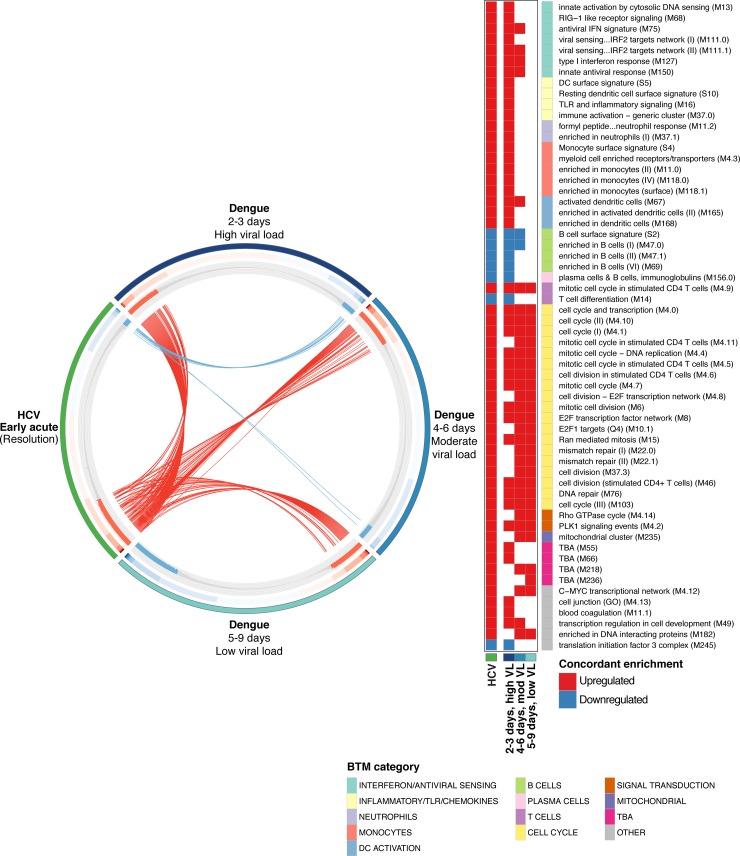
Fig 6. Comparison analysis of immune response to acute HCV and acute DENV infection.
CIRCOS plot indicating BTM enrichment patterns shared between the Early acute HCV and acute DENV responses (DENV subgroups as defined in the main text). BTMs are ordered along each DENV subgroup (or HCV) segment by GSEA NES values in the corresponding dataset. Outer track color indicates HCV/DENV dataset. Middle track heatmap plots NES values for each BTM. Inner track histogram plots -log10 p-values (GSEA pre-ranked) for BTM enrichment (relative to baseline); red positive bars indicate upregulation, blue negative bars indicate downregulation. For each DENV subgroup, each BTM demonstrating concordant activity (i.e. enriched, same directionality) with the response to acute HCV is linked by an arc to the HCV segment. Each arc is colored by directionality of concordant enrichment (red indicates upregulation, blue indicates downregulation). BTMs concordant between acute HCV and any DENV subgroup dataset are listed at right. Filled cells denote concordant enrichment relative to baseline (Both acute HCV and indicated DENV subgroup datasets GSEA pre-ranked q-value < 0.01); red indicates upregulation, blue indicates downregulation. BTM category indicated on color sidebar.

