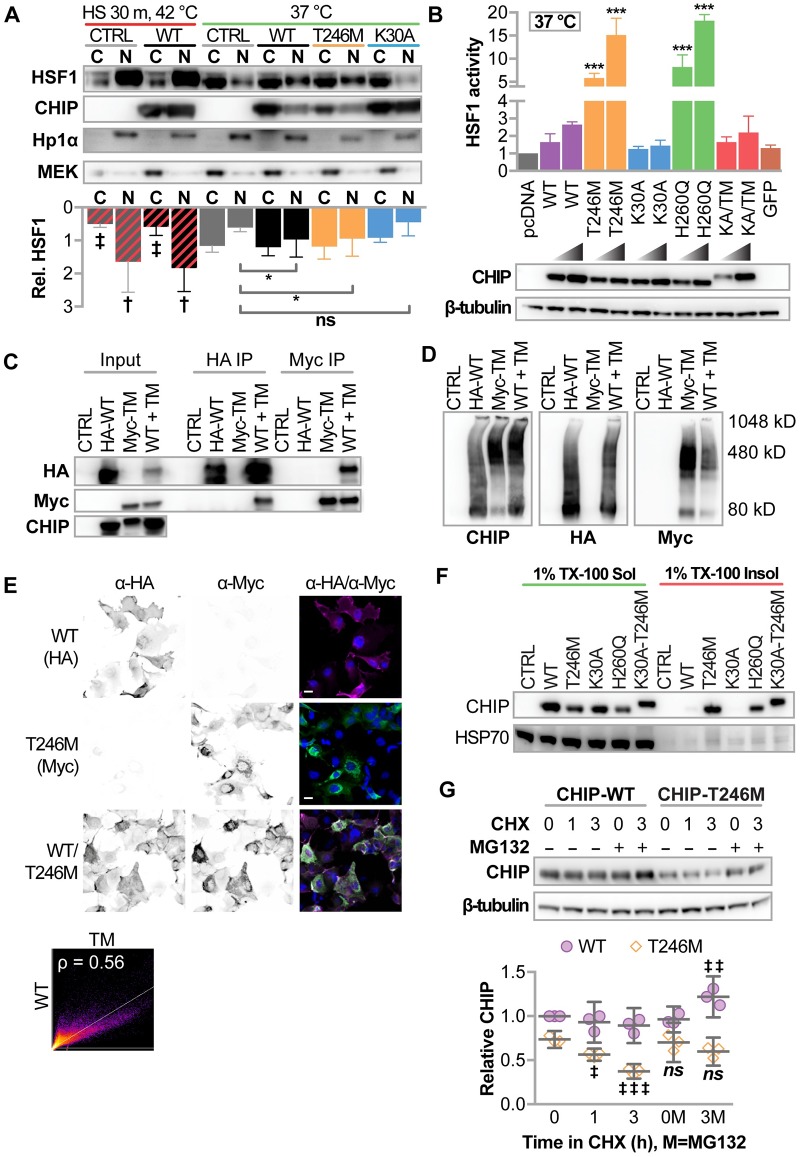
Fig 3. Cellular characterization of CHIP-T246M revealed enhanced activation of HSF1, changes in solubility, and increased turnover.
(A) Immunoblot analysis of HSF1, CHIP, HP1α (nuclear marker) and MEK (cytosolic marker) in cytosolic (C) and nuclear (N) fractions from COS-7 cells transiently transfected with the indicated vectors (CTRL = pcDNA3, WT = pcDNA3-mycCHIP, T246M = pcDNA3-mycCHIP-T246M, K30A = pcDNA3-mycCHIP-K30A) treated with or without heat shock as indicated. Densitometry of relative HSF1 protein is represented by the bar graph and 95% CI, N = 3 biological replicates; effect of heat shock: ‡ and † correspond to p < 0.01 and 0.0001 via Sidak’s post hoc comparison test to cytosolic or nuclear HSF1 in control conditions at 37 °C; effect of CHIP transgene: * p < 0.05 via Dunnett’s post hoc comparison to nuclear HSF1 levels in control conditions. (B) Bar graph of HSF1 transcription activity represented by the mean and 95% CI normalized to control vector (pcDNA) conditions in COS-7 cells transiently transfected with increasing amount if DNA using the indicated vectors (K30A-T246M = pcDNA3-mycCHIP-K30A-T246M, GFP = green fluorescent protein), N = 4 biological replicates, *** p < 0.0001 via Dunnet’s multiple comparison test to WT conditions. Immunoblot analysis of the myc-tag and β-tubulin confirmed transgene expression. (C) COS-7 cells were co-transfected with the indicated vectors (transgenes, HA-WT = pcDNA3-HA-CHIP, Myc-TM = pcDNA3-mycCHIP-T246M, WT + TM = HA-WT and Myc-TM). CHIP protein was immunoprecipitated with Anti-HA or Anti-Myc affinity gel. The inputs and resulting precipitants (IP) were separated by SDS-PAGE and immunoblotted with the indicated antibodies. (D) COS-7 cells were co-transfected with the indicated transgenes and cell lysates were separated by BN-PAGE and immunoblotted with the indicated antibodies. Locations of molecular weight standards in kilodaltons (kD) are indicated. (E) Micrographs of indirect immunofluorescence from COS-7 expressing the indicated transgenes to detect CHIP-WT (left), CHIP-T246M (center), or both (right). DAPI nuclear staining is also included (right panels) and the scale bar represents 20 microns. Co-localization of HA-WT and Myc-TM is represented by scatter plot and the indicated Pearson correlation (ρ). (F) Solubility analysis (in 1% Triton X-100, TX-100) of CHIP proteins, HSP70, and AMPKα in COS-7 cells determined by immunoblot analysis. (G) Immunoblot analysis of CHIP expression (top) in COS-7 cells treated with 50 μg/ml cycloheximide (CHX) for the indicated time (h) in the presence or absence of 20 μM MG132. β-tubulin. Densitometry analysis (bottom) represented by dot plot and summarized by the mean ± 95% CI of relative levels of CHIP protein were normalized to β-tubulin, N = 3 biological replicates, ‡, ‡‡, ‡‡‡ correspond to p < 0.05, 0.01, 0.0001 compared to starting expression levels within each construct via Tukey’s post hoc test.

