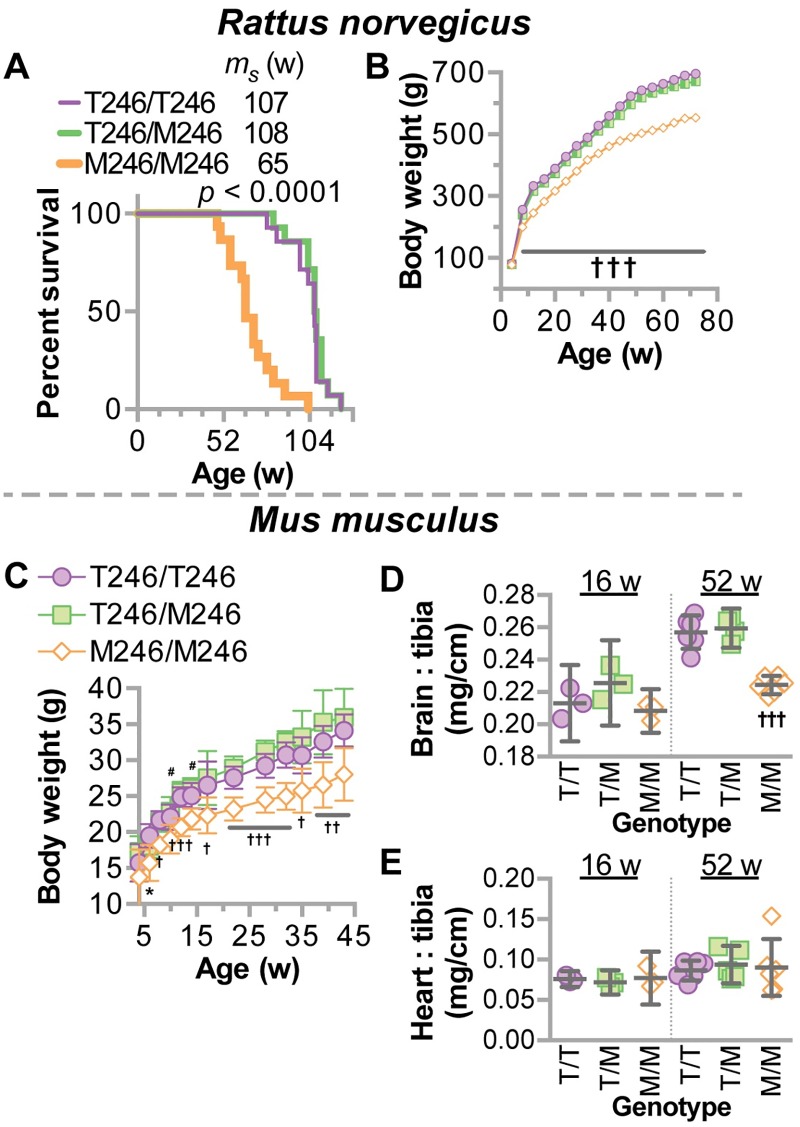
Fig 6. Decreased mortality and weight in CHIP-T246M rodents.
(A) Survival analysis of rats with the indicated genotypes (Mantel-Cox test) with the median survival (ms) indicated in weeks (w), N = 12 animals per genotype. Total body weight of (B) rats or (C) mice with the indicated genotypes over age represented by scatter plot and summarized by the mean ± 95% CI. For rats, N = 10 (per genotype); for mice, N = 30, 29, and 18 for T/T, T/M, and M/M, respectively. Tukey’s post hoc test: * p < 0.05 M/M vs. T/T; †, ††, ††† correspond to p < 0.05, 0.01, 0.001 comparing M/M to T/T and T/M; # p < 0.05 M/M vs. T/M. (D) brain weight or (E) heart weight normalized to tibia length from mice with indicated genotypes represented by dot plot and summarized by the mean ± 95% CI: ††† corresponds to p < 0.001 comparing M/M to T/T and T/M.

