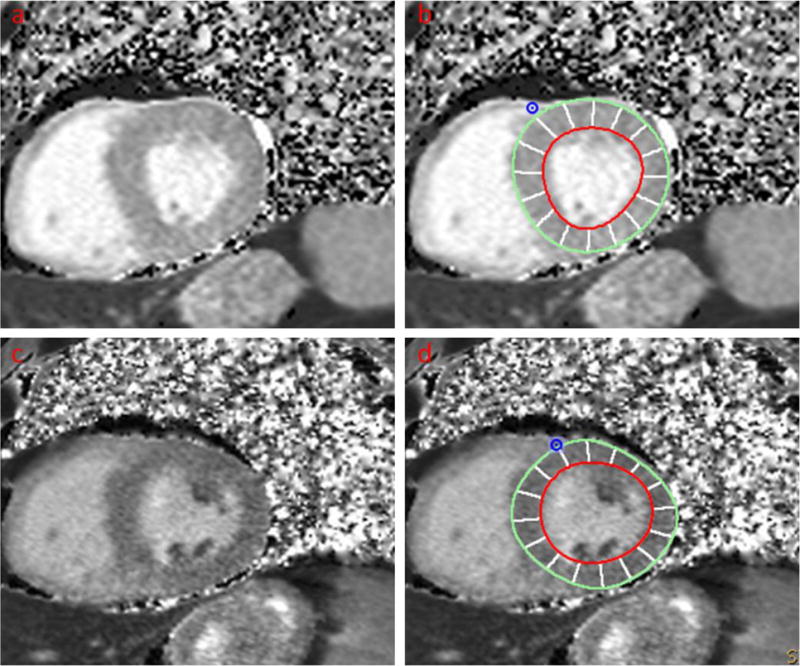
Figure 1.

A healthy volunteer. Two consecutive scans were performed with interval of 14 days.
a Short-axis view of LV without contours (scan #1)
b Short-axis view of LV with contours (scan #1)
c Short-axis view of LV without contours (scan #2)
d Short-axis view of LV with contours (scan #2)
