Figure 3.


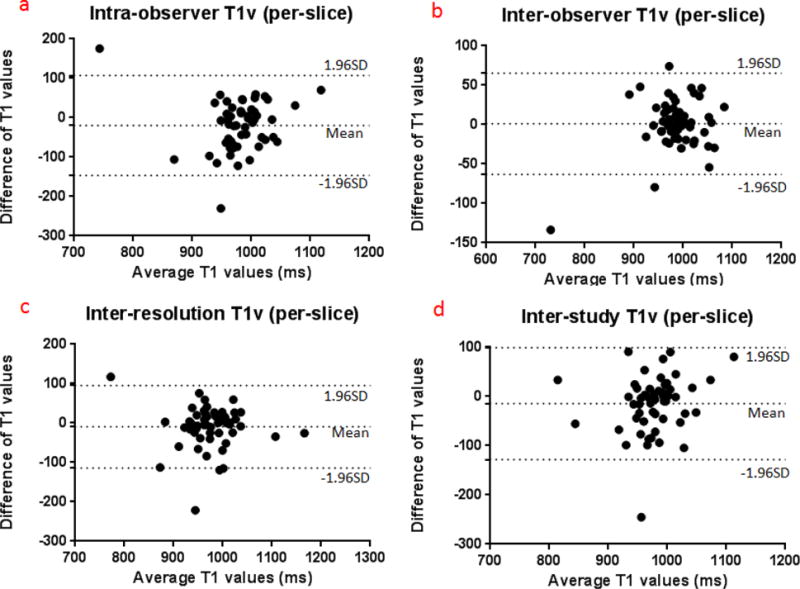
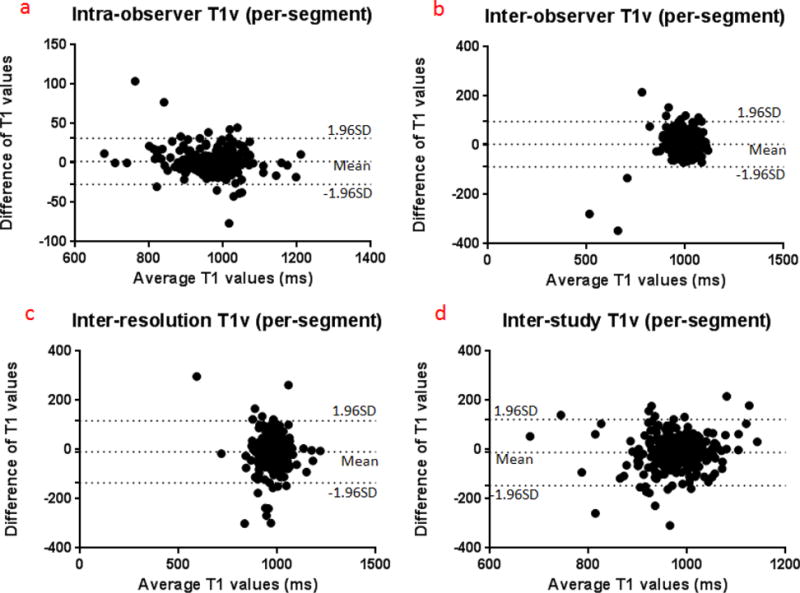
Bland-Altman plots presenting the differences between duplicated measurements (based on T1 values acquired with low resolution MOLLI).
a T1v on a per-slice basis
b T1v on a per-segment basis


Bland-Altman plots presenting the differences between duplicated measurements (based on T1 values acquired with low resolution MOLLI).
a T1v on a per-slice basis
b T1v on a per-segment basis