
Figure 2.
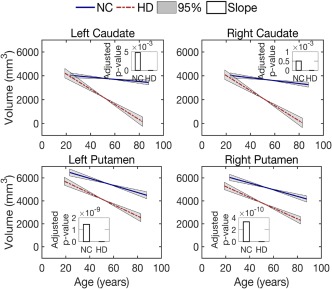
Volume loss of the caudate and putamen over age. Lines illustrate estimates of the group trend for each population, normal controls (NC) or subjects with Huntington's disease (prodromal‐HD). Gray areas show the 95% confidence intervals for the estimated group trends. Bars indicate the FDR‐corrected p‐values for the estimation of slope (decay rate) [Color figure can be viewed at http://wileyonlinelibrary.com]