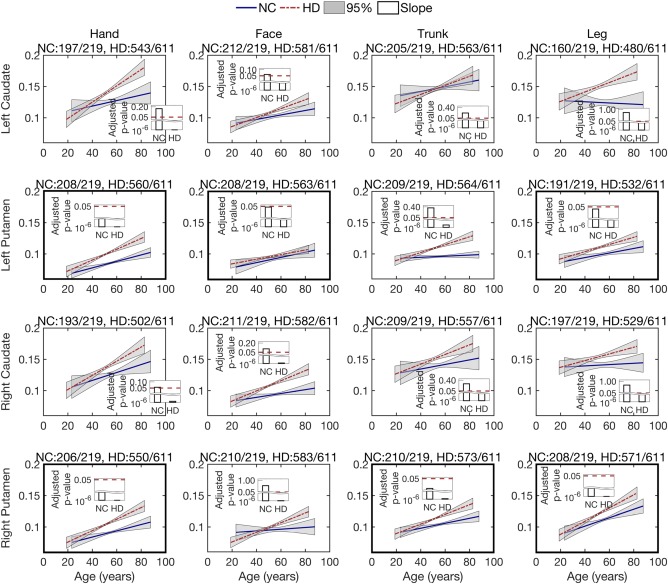
Figure 3.

Longitudinal analysis of the isotropic volume fraction of the caudate and putamen, connected with four motor regions, that is, hand, face, trunk, and leg. Lines show the estimated group trend for each population, normal control (NC) and prodromal‐HD. Gray areas show the 95% confidence intervals for the estimated group trends. Bars present the FDR‐adjusted p‐values for the estimation of slope using the linear mixed‐effects model. An adjusted p‐value less than .05 indicates the estimate is significant and reliable. The title of each sub‐figure details tractography connections that were reliably traced from the total scans in each group [Color figure can be viewed at http://wileyonlinelibrary.com]
