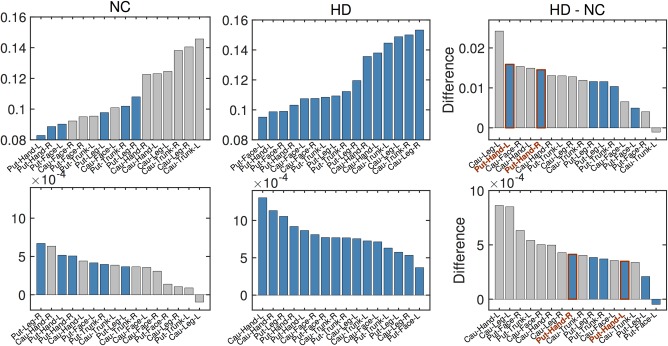
Figure 4.

Comparison of the isotropic volume fraction between Normal Control (NC) and prodromal‐HD groups. Top: the averaged isotropic volume fraction values estimated at the age of 50 years old for different regions. Bottom: the degeneration rates (slopes of estimated group trends) for different regions. From left to right: NC group, HD group, and their differences. Gray bars were used in those regions where estimate for the slope is not significant at the level of .05 (i.e., no significant correlation between isotropic volume fraction and age), while blue bars indicate that the results are significant at the level of .05. (Cau: Caudate, Put: Putamen) [Color figure can be viewed at http://wileyonlinelibrary.com]
