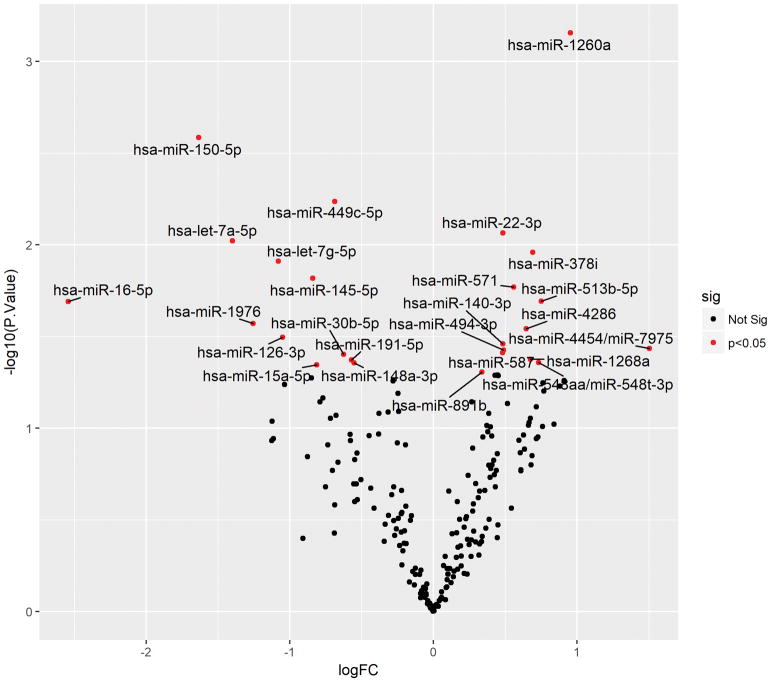
Figure 1. Volcano plot showing the fold change versus negative log of the p-value of differentially expressed miRNAs.
The false discovery rate (FDR) cutoff imposed to define the statistical significance threshold of p<0.0046 (at y=2.337) indicates statistical significance of two miRs that passed this criterion, miR-1260a and miR-150-5p.

