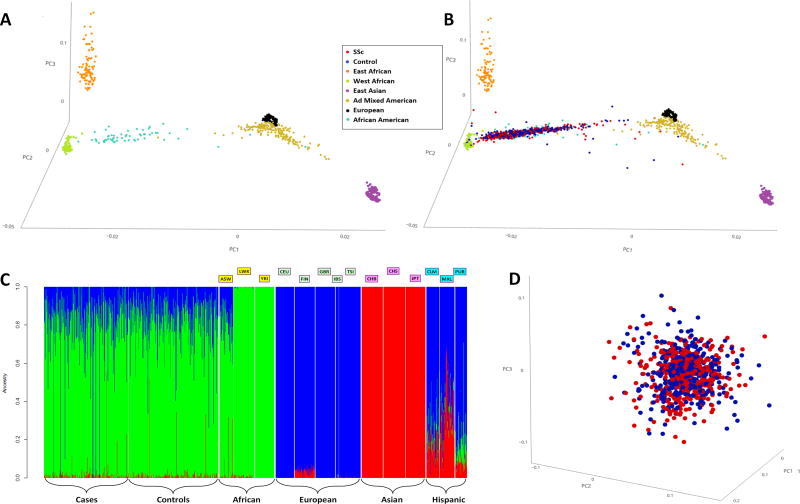
Figure 1. 1A, 3D Principal Component Analysis plotting the 1000 genomes populations; 1B, 3D Principal Component Analysis plotting the 1000 genomes populations along with the SSc cases and controls; 1C, Admixture plot of the SSc cases and controls along with the 1000 genomes populations; and 1D, 3D principal component analysis plotting the SSc cases and controls.
1A, 1B: Each dot represents an individual. Red- SSc cases; Blue- Controls; Gold- Ad Mixed American:CLM, MXL, PUR; Light Blue- African American; Orange- East African: LWK; Purple- East Asian:CBB, CHS, JPT; Black- European:CEU,FIN,GBR,IBS,TSI; Light Green- West African:YRI. Principal component analysis shown with the top 3 principal components.
1C: Each individual is represented as a vertical bar. The Y-axis depicts contributions from the African (Green), European (Blue), and Asian (Red) ancestries. The cases and controls look very similar to each other and similar to the ASW from the 1000 genomes project.
1000 genomes populations: ASW-Americans of African Ancestry in SW USA, LWK-Luhya in Webuye, Kenya, YRI-Yoruba in Ibadan, Nigeria, CEU-Utah residents with Northern and Western European ancestry, FIN-Finnish in Finland, GBR-British in England and Scotland, IBS-Iberian Population in Spain, TSI-Toscani in Italia, CHB-Han Chinese in Beijing, China, CHS-Southern Han Chinese, JPT-Japanese in Tokyo, Japan, CLM-Colombians from Medellin, Colombia, MXL-Mexican Ancestry from Los Angeles USA, PUR-Puerto Ricans from Puerto Rico.
1D: Red- SSc cases; Blue- Controls. Each dot represents an individual. Principal component analysis shown with the top 3 principal components.

