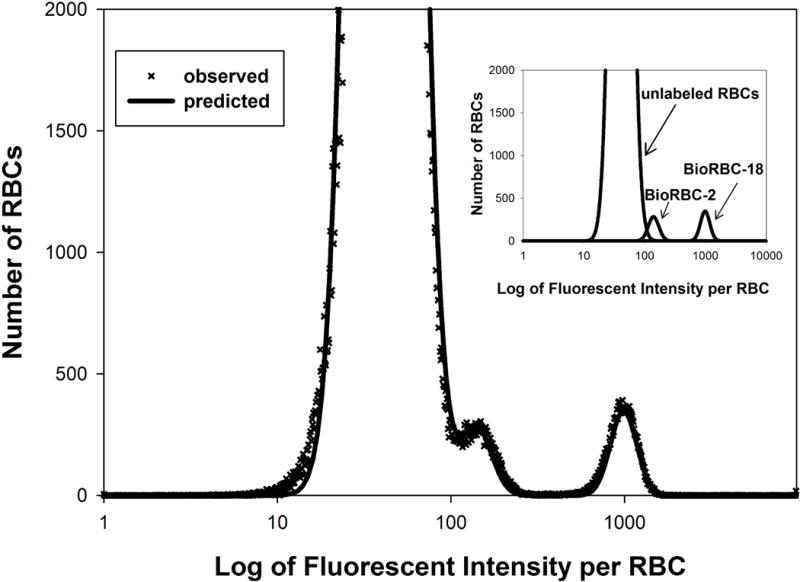
Figure 7.

Representative flow cytometric histogram of blood sample obtained after BioRBC transfusion. The number of RBCs enumerated is plotted versus the log of fluorescent intensity per RBC. Peaks are evident for unlabeled RBC, BioRBC-2, and BioRBC-18. The unlabeled RBC peak overlaps the BioRBC-2 peak. The inset illustrates peak quantitation adjusting for peak overlap using mixed effect analysis using mixture modeling.
