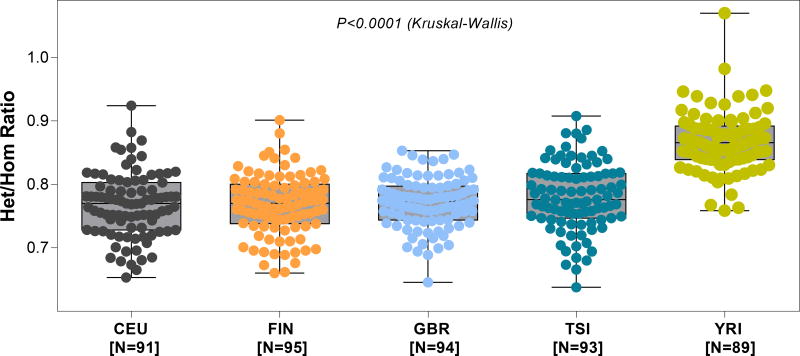
Figure 3. Het/Hom ratio by population derived from mRNA sequencing of 462 lymphoblastoid cell lines.
In order to assess the variability of Het/Hom ratio at a population level for “normal” cells, we used the gEUVADIS (Genetic European Variation in Health and Disease), RNA sequencing project data. This is a European medical sequencing consortium with a publicly available database of mRNA and small RNA sequencing from 462 lymphoblastoid cell line samples from five populations of the 1000 Genomes Project. The five populations depicted in the above panels are: (i) CEU- Utah, USA, residents with Northern and Western European ancestry (N=92), (ii) FIN- Finnish in Finland (N=95), (iii) GBR- British in England and Scotland (N=94), (iv) TSI- Tuscany in Italy (N=93), and (v) YRI- Yoruba in Ibadan, Nigeria (N=89). The figure depicts the box plot of Het/Hom ratio derived from the RNA sequencing data of the five populations. The median Het/Hom ratio was 0.770 for CEU; 0.770 for FIN; 0.773 for GBR; 0.776 for TSI and 0.866 for YRI. The difference in the Het/Hom ratio among the groups was statistically significant (P<0.0001, Kruskal -Wallis test). By Dunn’s test, the difference in the Het/Hom ratio between YRI and each of the other four groups was statistically significant (P<0.05). None of the other pair-wise comparisons were statistically significant (all P>0.05).

