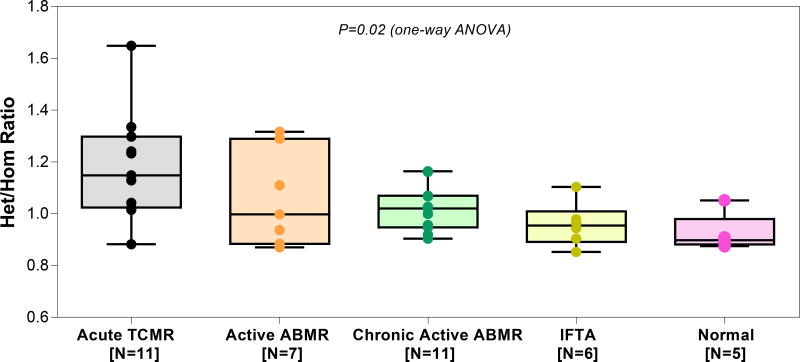
Figure 4. Het/Hom ratio by diagnostic categories of the 40 allograft biopsies.
Boxplot and individual data points of the Het/Hom ratios computed from RNA sequencing data of 40 kidney allograft biopsy samples, stratified by kidney allograft biopsy diagnosis category. Acute TCMR, acute T-cell mediated rejection, Active ABMR, active antibody-mediated rejection, Chronic active ABMR, chronic and active antibody-mediated rejection, IFTA, interstitial fibrosis and tubular atrophy or normal allograft biopsy (Normal). Biopsies were categorized using the Banff 2017 update of the Banff ‘97 classification scheme. The median Het/Hom ratio was 1.149 in acute TCMR, 0.997 in active ABMR, 1.020 in chronic active ABMR, 0.954 in IFTA and 0.898 in Normal. The difference in Het/Hom ratio among the diagnostic categories was significant (P=0.02, Kruskal-Wallis test). By Dunn’s test, difference in Het/Hom ratio between acute TCMR and IFTA (P,0.05), and between acute TCMR and Normal (P<0.05) was statistically significant. None of the other pair-wise comparisons were statistically significant (all P>0.05).

